Usage
The Usage page gives you a complete picture of your PipeOps resource consumption — from plan limits and wallet credit to Nova server charges and BYOS gateway bandwidth. Use it to monitor costs, top up resources, and understand which projects are driving usage.
Accessing the Usage Page
- Sign in to your PipeOps dashboard at https://console.pipeops.io/auth/signin.
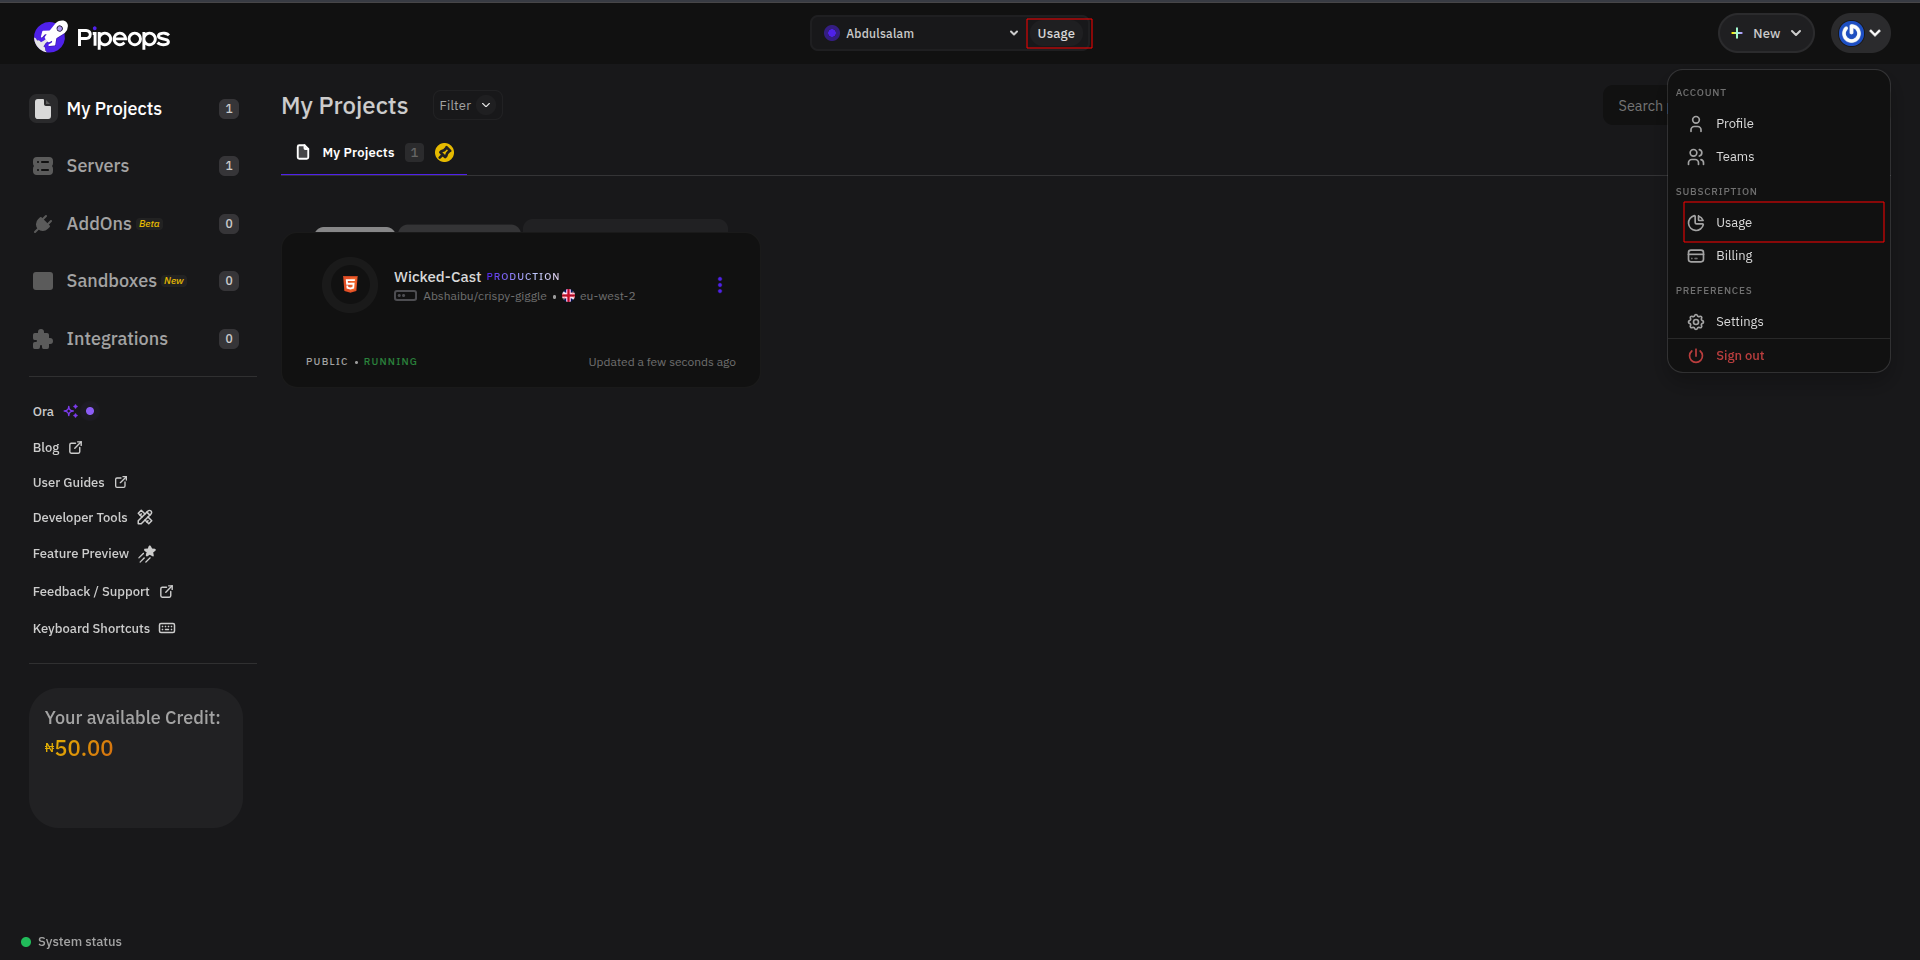
- Click the account menu at the top-right corner of your dashboard.
- Under Subscription, select Usage.
- Alternatively, click the Usage button directly from the workspace switcher in the top navigation bar.
The Usage page is organized into three tabs:
| Tab | What it shows |
|---|---|
| Active Subscription | Plan limits, available credit, and subscription details |
| Nova Usage | Projected charges and resource breakdown for Nova-deployed servers |
| BYOS Bandwidth | Gateway bandwidth usage and estimated costs for BYOS clusters |
Active Subscription
The Active Subscription tab gives you an overview of your current plan, how much of each resource you've used, and your wallet balance.
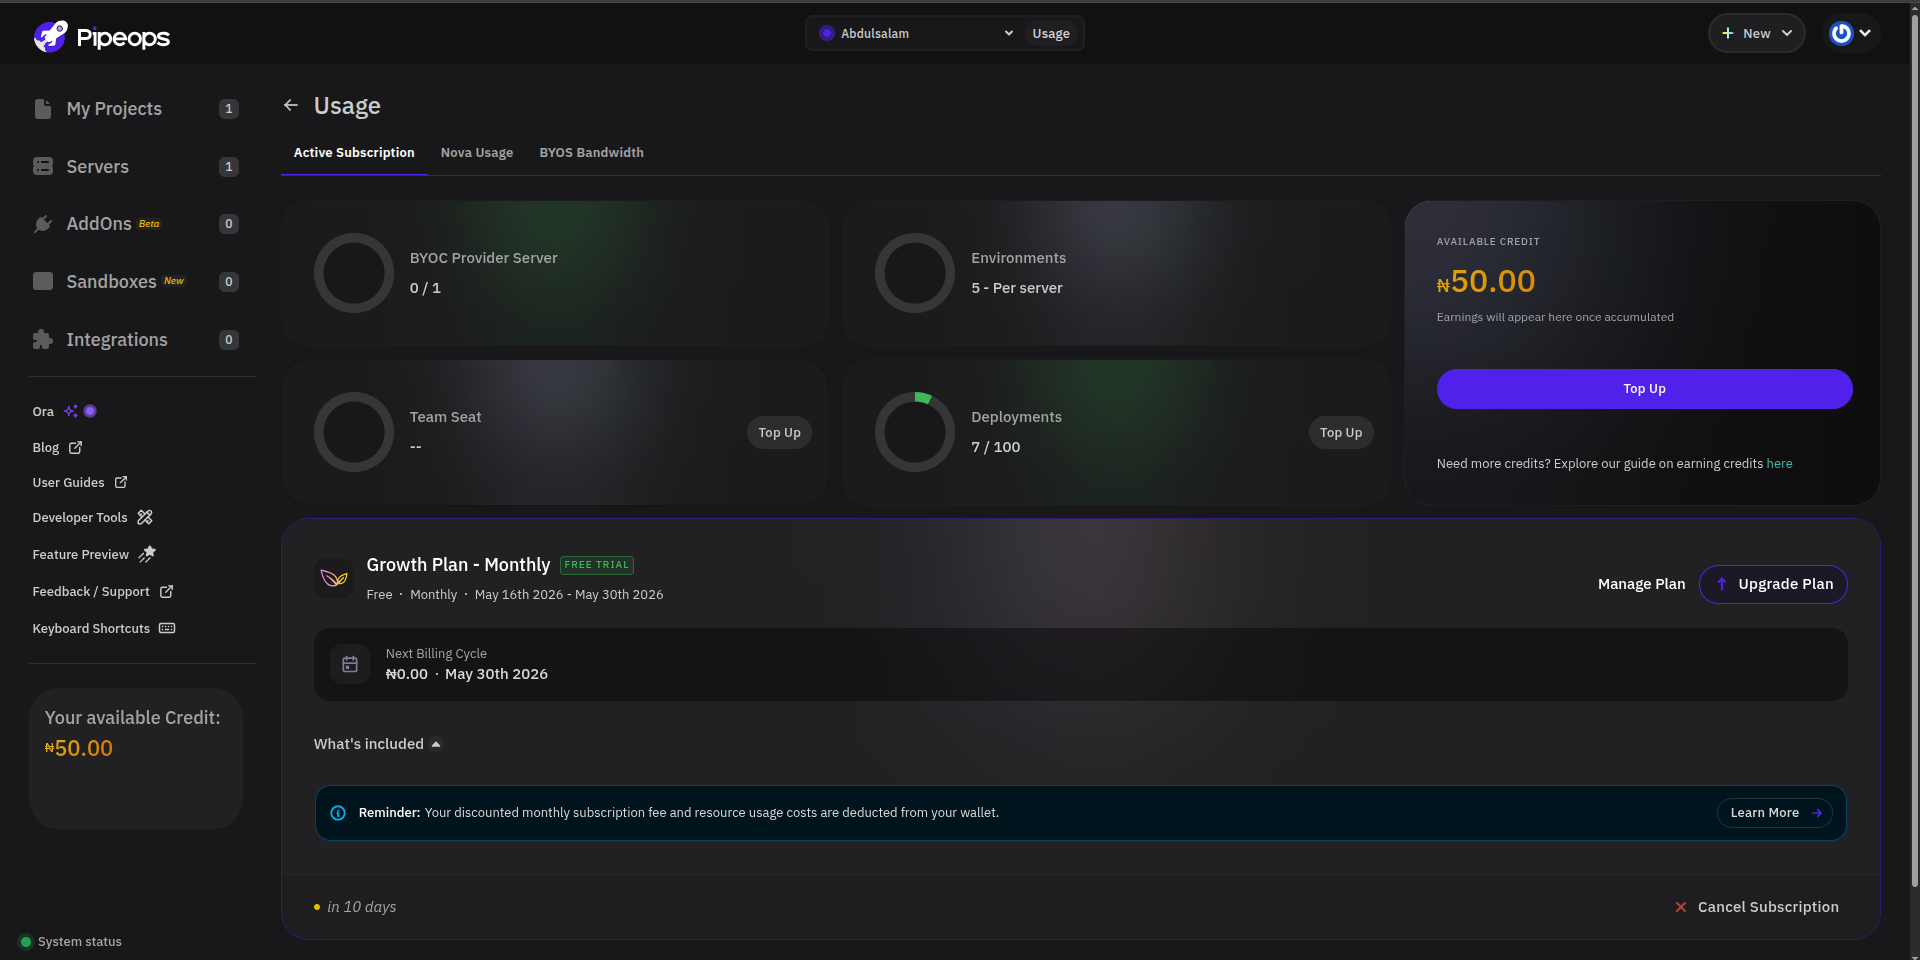
Resource Usage
At the top of the tab, your current resource usage is shown across four areas:
- BYOC Provider Server — Number of BYOC provider servers created against your plan limit.
- Environments — Number of environments available per server under your current plan.
- Team Seats — Number of team seats in use. Click Top Up to purchase additional seats.
- Deployments — Number of deployments used against your plan's deployment limit. Click Top Up to increase your allowance.
Available Credit
The Available Credit card displays your current wallet balance. Click Top Up to add credit. A link below the button provides guidance on how to earn credits if needed.
PipeOps deducts your discounted monthly subscription fee and all resource usage costs from your wallet or connected card, depending on which has sufficient balance to cover the amount due.
Plan Details
The plan section shows your active plan name, billing interval, subscription period, and next billing cycle, along with the benefits included in your plan. From here you can:
- Click Upgrade Plan to review, adjust your plan settings, or move to a higher tier.
- Click Cancel Subscription to end your current subscription.
Nova Usage
The Nova Usage tab shows a breakdown of resource consumption and projected costs for servers running on PipeOps Nova.
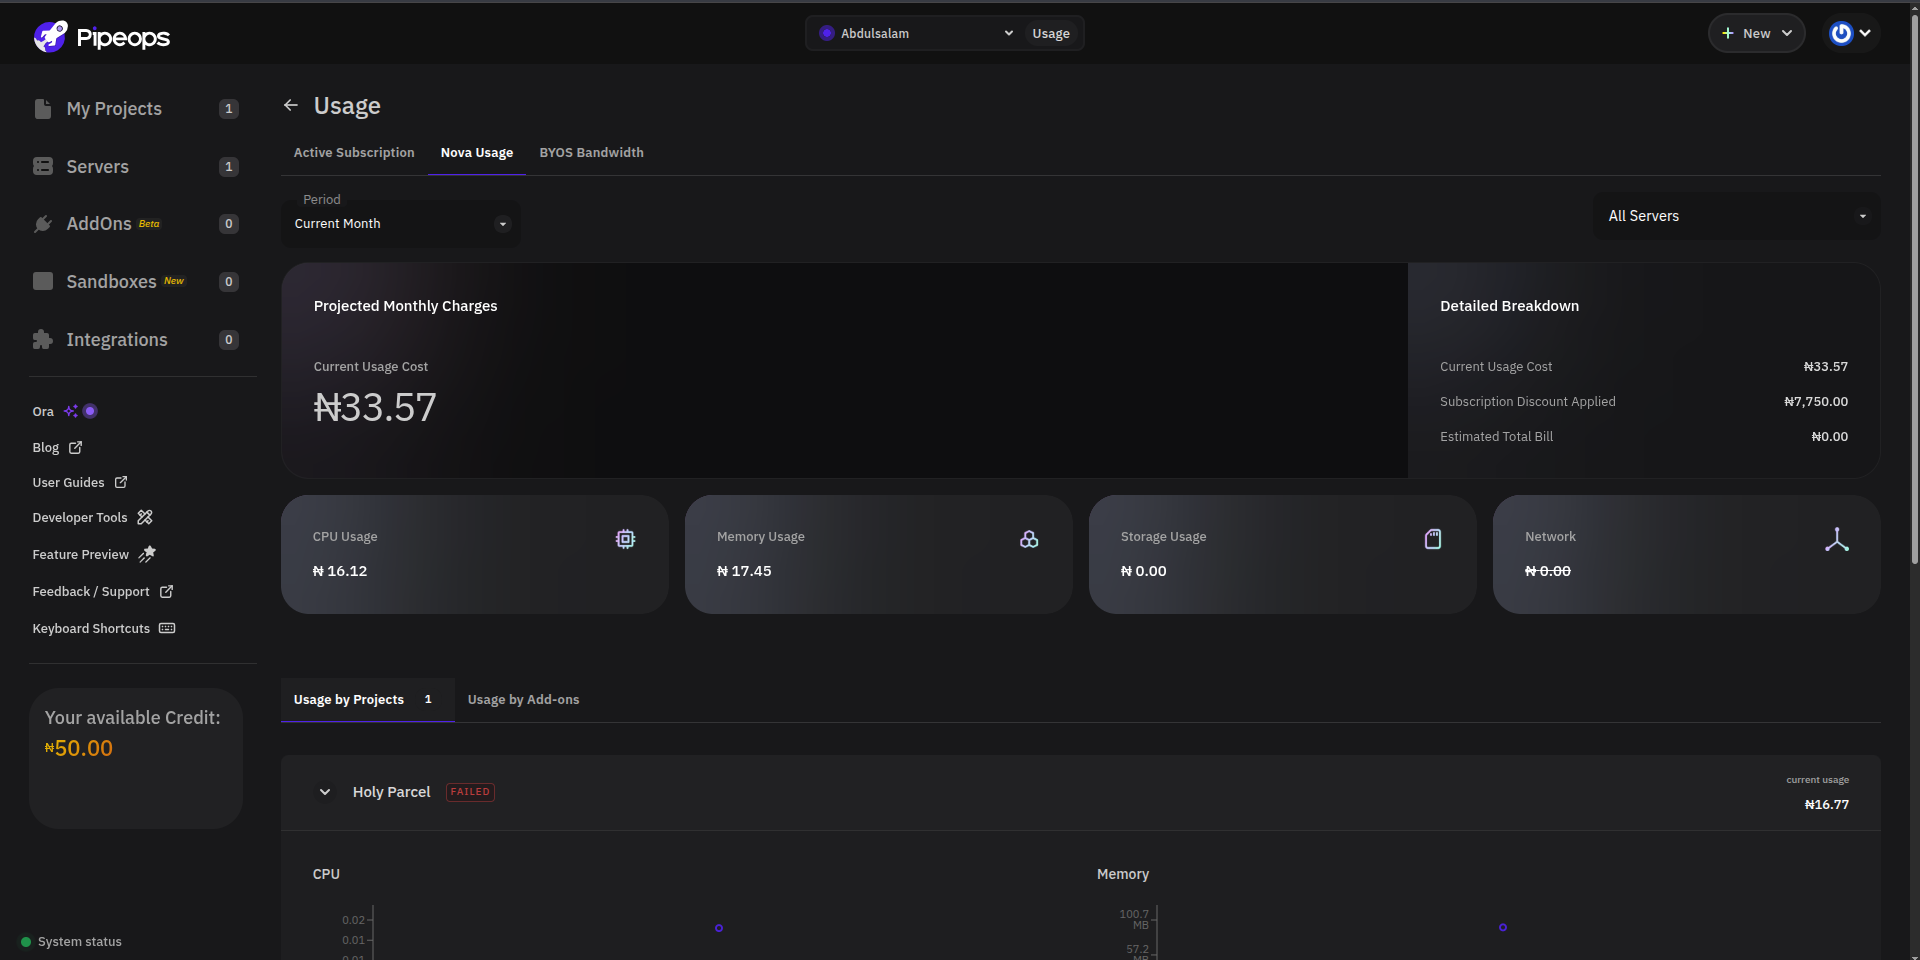
Filters
Use the filters at the top of the tab to scope the data:
- Period — Select the time range to review (e.g. current month).
- Server — Choose All Servers or select a specific server.
Projected Charges
The projected charges section summarizes your estimated bill for the selected period:
- Current Usage Cost — Cost accrued so far in the selected period.
- Subscription Discount Applied — Any plan-based discount deducted from your usage cost.
- Estimated Total Bill — Your projected amount due after discounts.
Below the summary, individual cards show costs broken down by CPU, Memory, Storage, and Network.
Usage by Project
The project breakdown table lists every project that contributed to usage in the selected period. Click on a project to expand it and view:
- CPU, memory, and storage usage charts for that project
- Each resource's percentage share of the total cost
- The project's total cost for the period
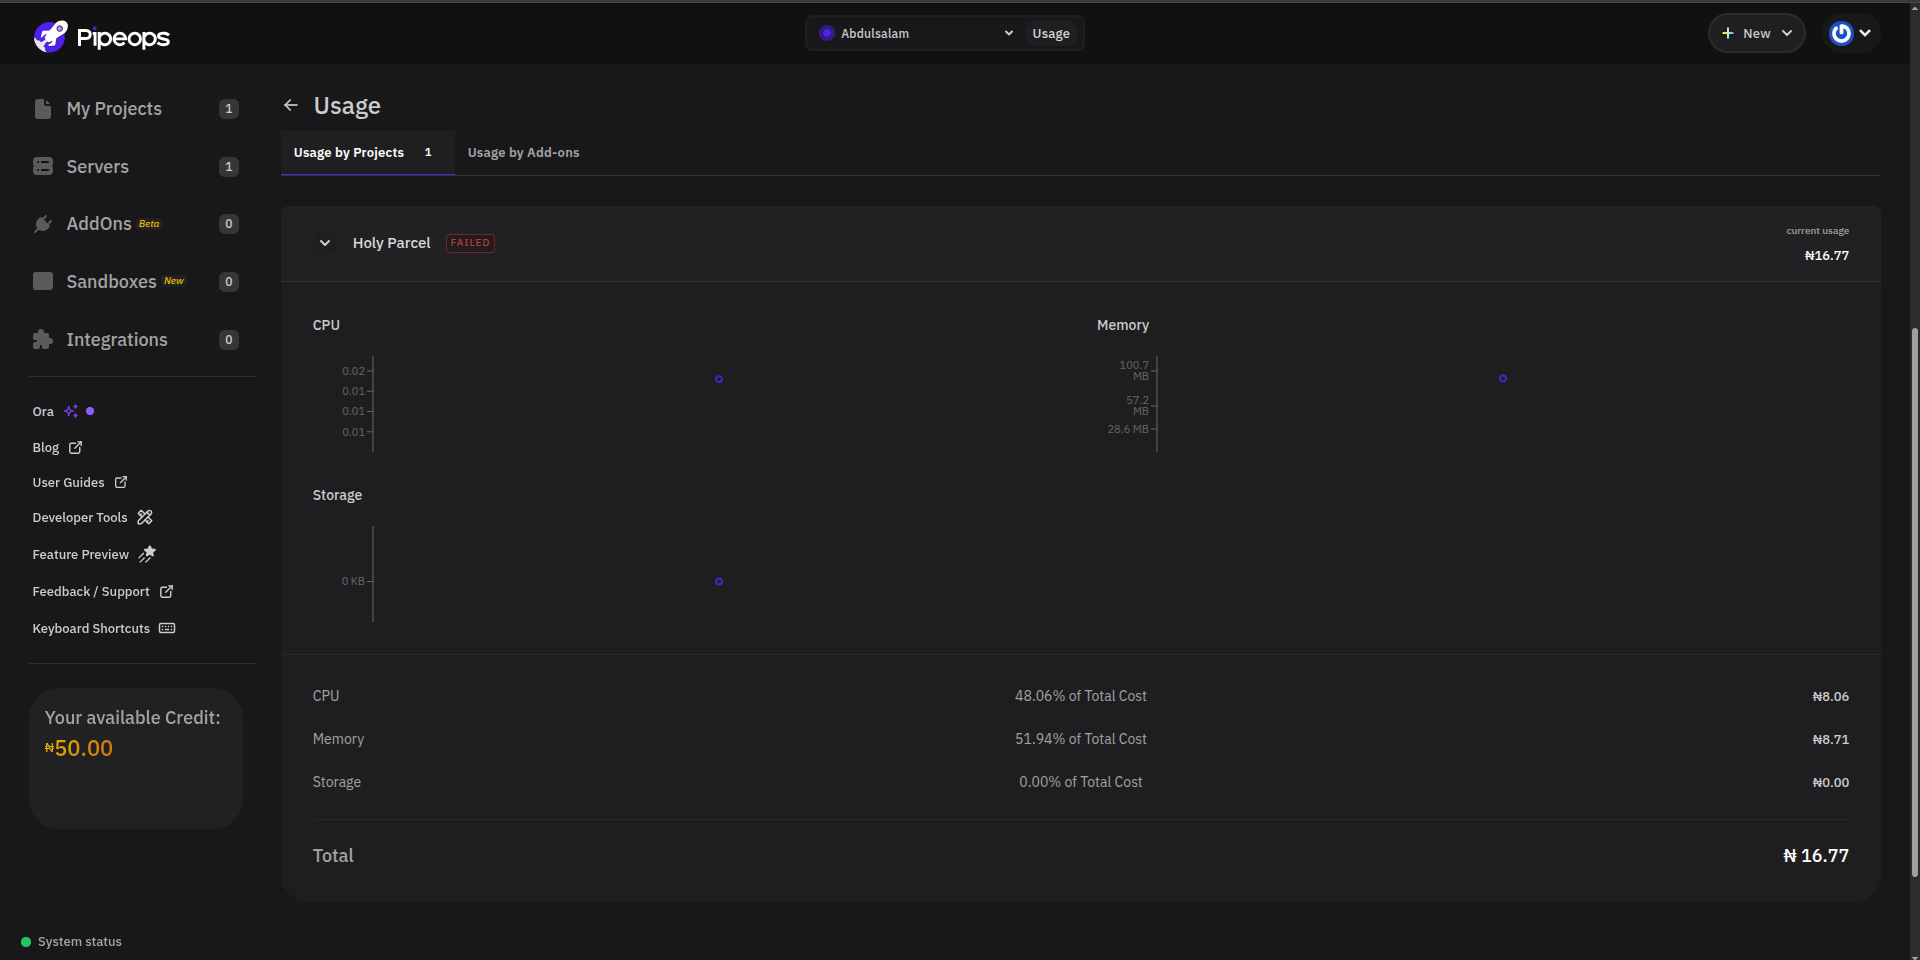
This breakdown helps you identify which projects are contributing most to your Nova costs and where to optimize.
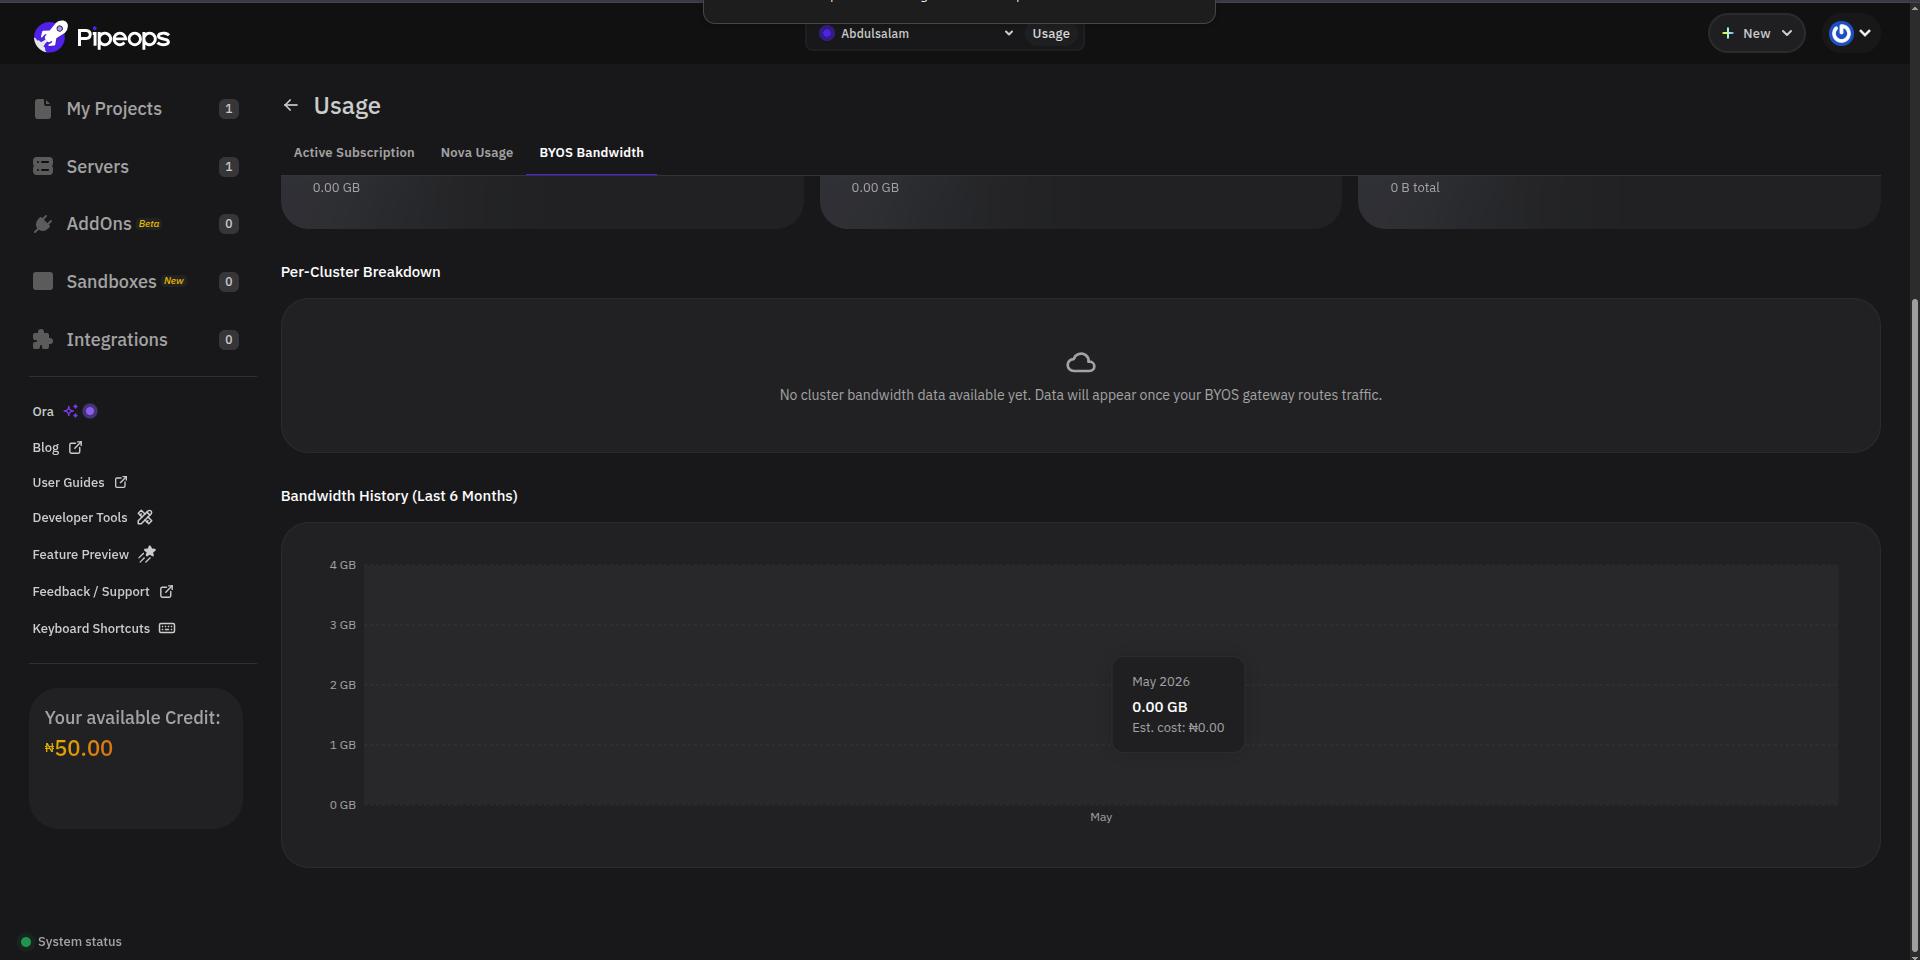
BYOS Bandwidth
The BYOS Bandwidth tab tracks data transfer through your BYOS gateway and estimates the associated costs for the current month.
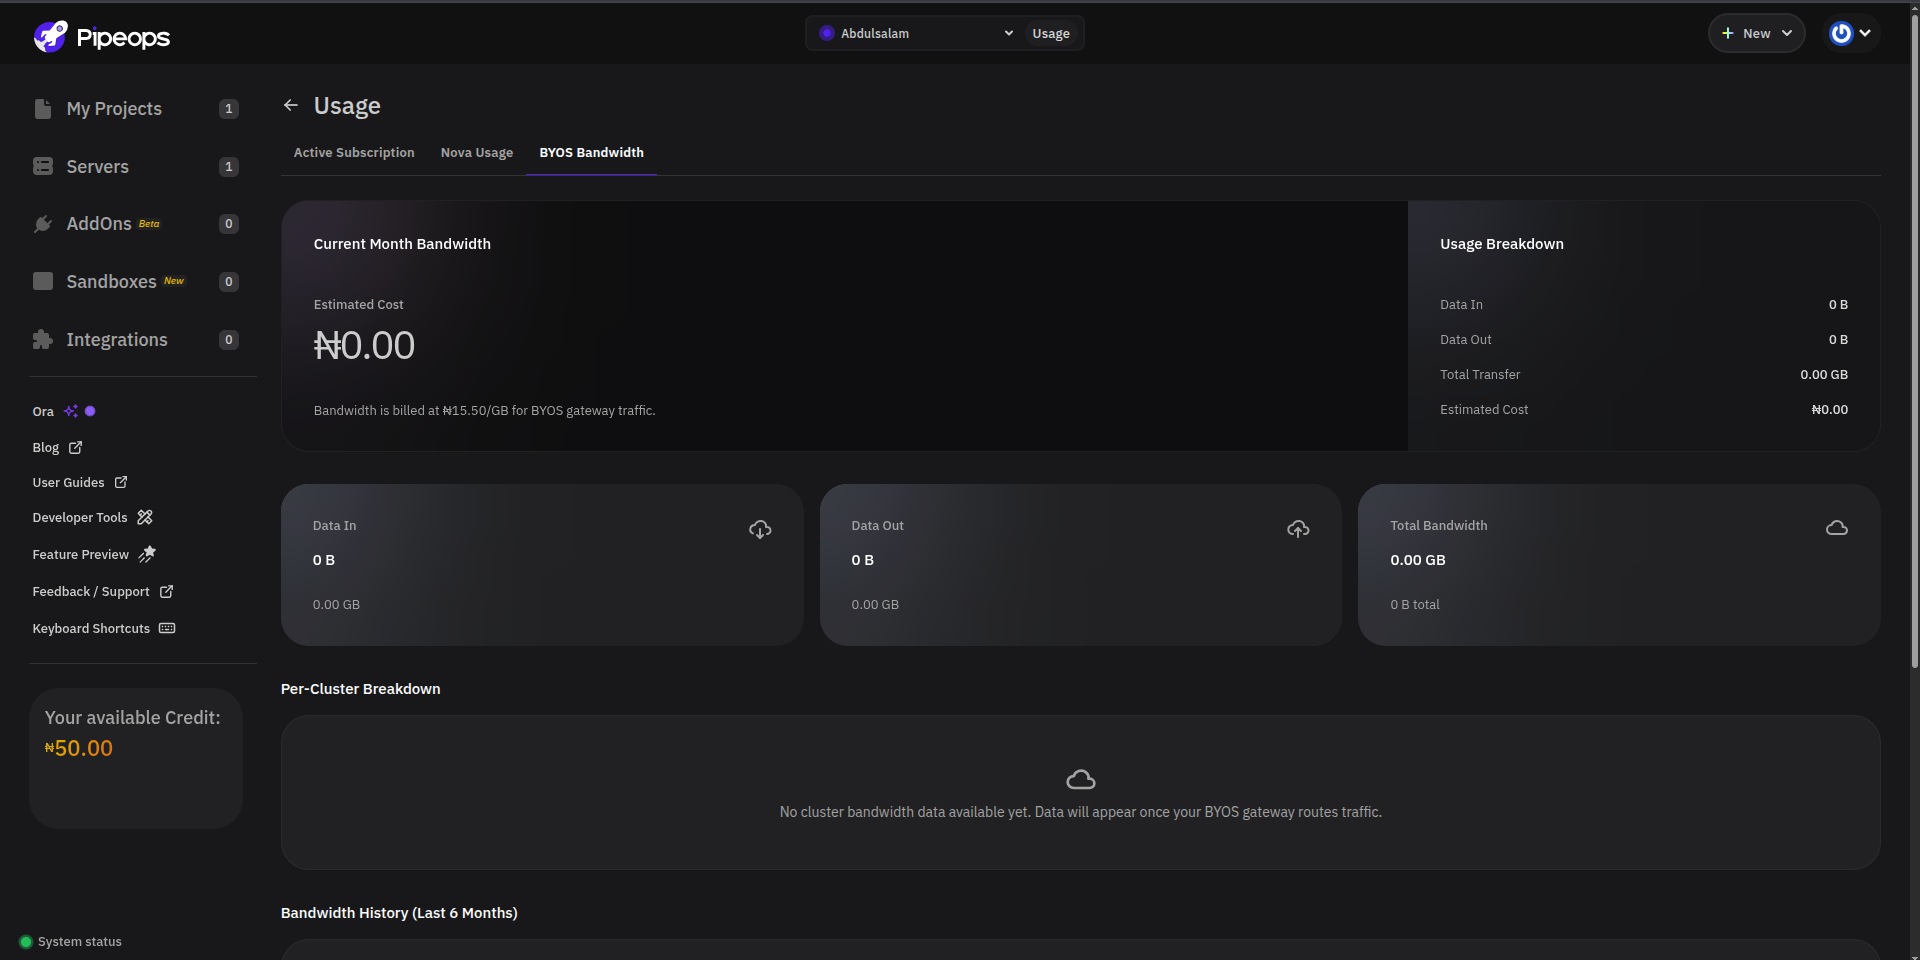
Current Month Summary
The summary cards at the top show:
- Estimated Cost — Projected bandwidth cost for the current month.
- Data In — Total incoming traffic through the BYOS gateway.
- Data Out — Total outgoing traffic through the BYOS gateway.
- Total Transfer — Combined inbound and outbound bandwidth.
Bandwidth is billed per GB for all BYOS gateway traffic.
Per-Cluster Breakdown
The Per-Cluster Breakdown section shows bandwidth usage split by individual cluster. This is useful when you have multiple BYOS clusters and want to identify which one is generating the most traffic.
Bandwidth History
The Bandwidth History (Last 6 Months) chart shows your monthly transfer volume and estimated cost over the past six months, giving you a trend view for capacity planning.