Server Observability
Overview
This documentation guides you through the process of accessing and exploring metrics for your deployed servers using PipeOps. With PipeOps, you can gain valuable insights into the performance and behavior of your servers.
Accessing Server Metrics
To view the metrics for your server, follow these steps:
- Navigate to your server in PipeOps.
- Click on the "Observability" tab to access an overview of the server metrics, providing a high-level summary of its performance.
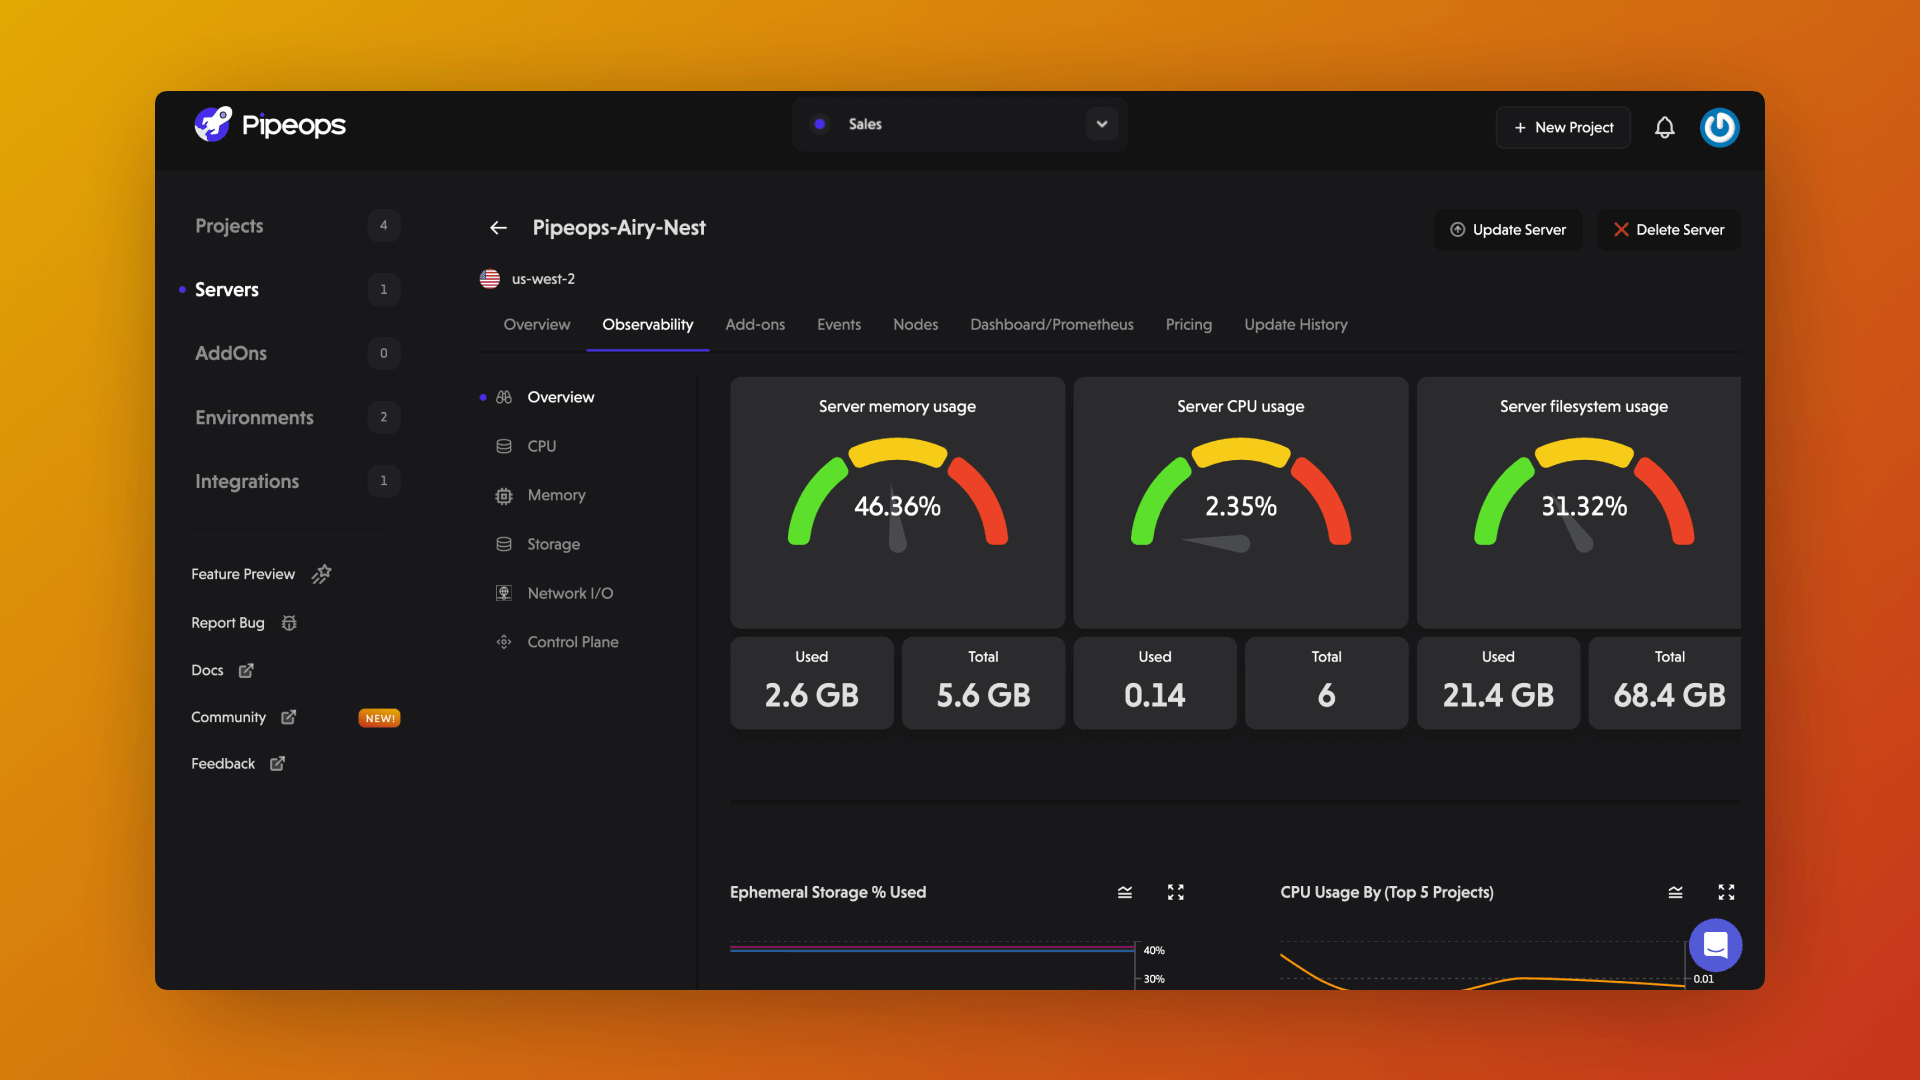
The image above illustrates the server metrics overview, offering a quick glimpse of how your server is performing in various metrics.
Exploring Individual Metrics
PipeOps allows you to dive deeper into the details of each metric. Let's explore some key metrics available:
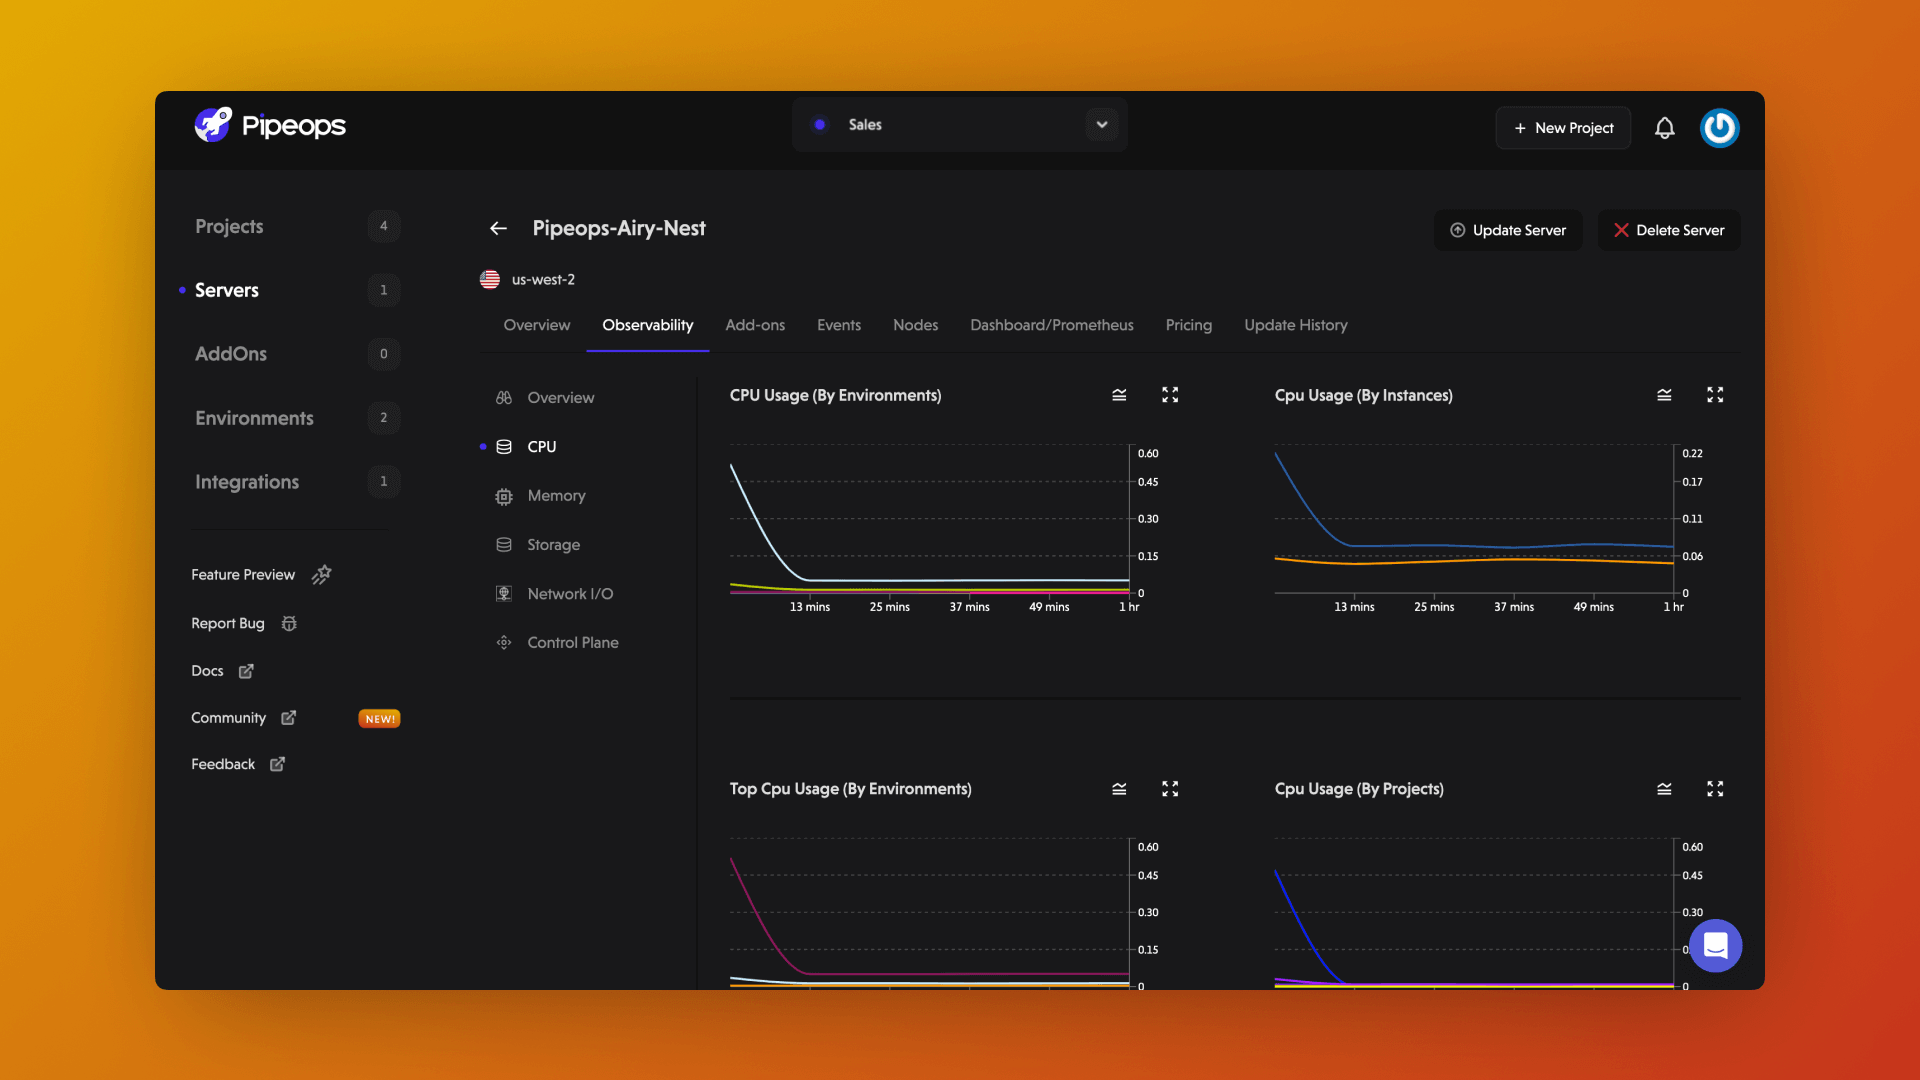
CPU Metric
The CPU metric provides insights into the CPU usage of your server, helping you understand the processing power consumed by your applications. Here's an example of how the CPU metric might be visualized:
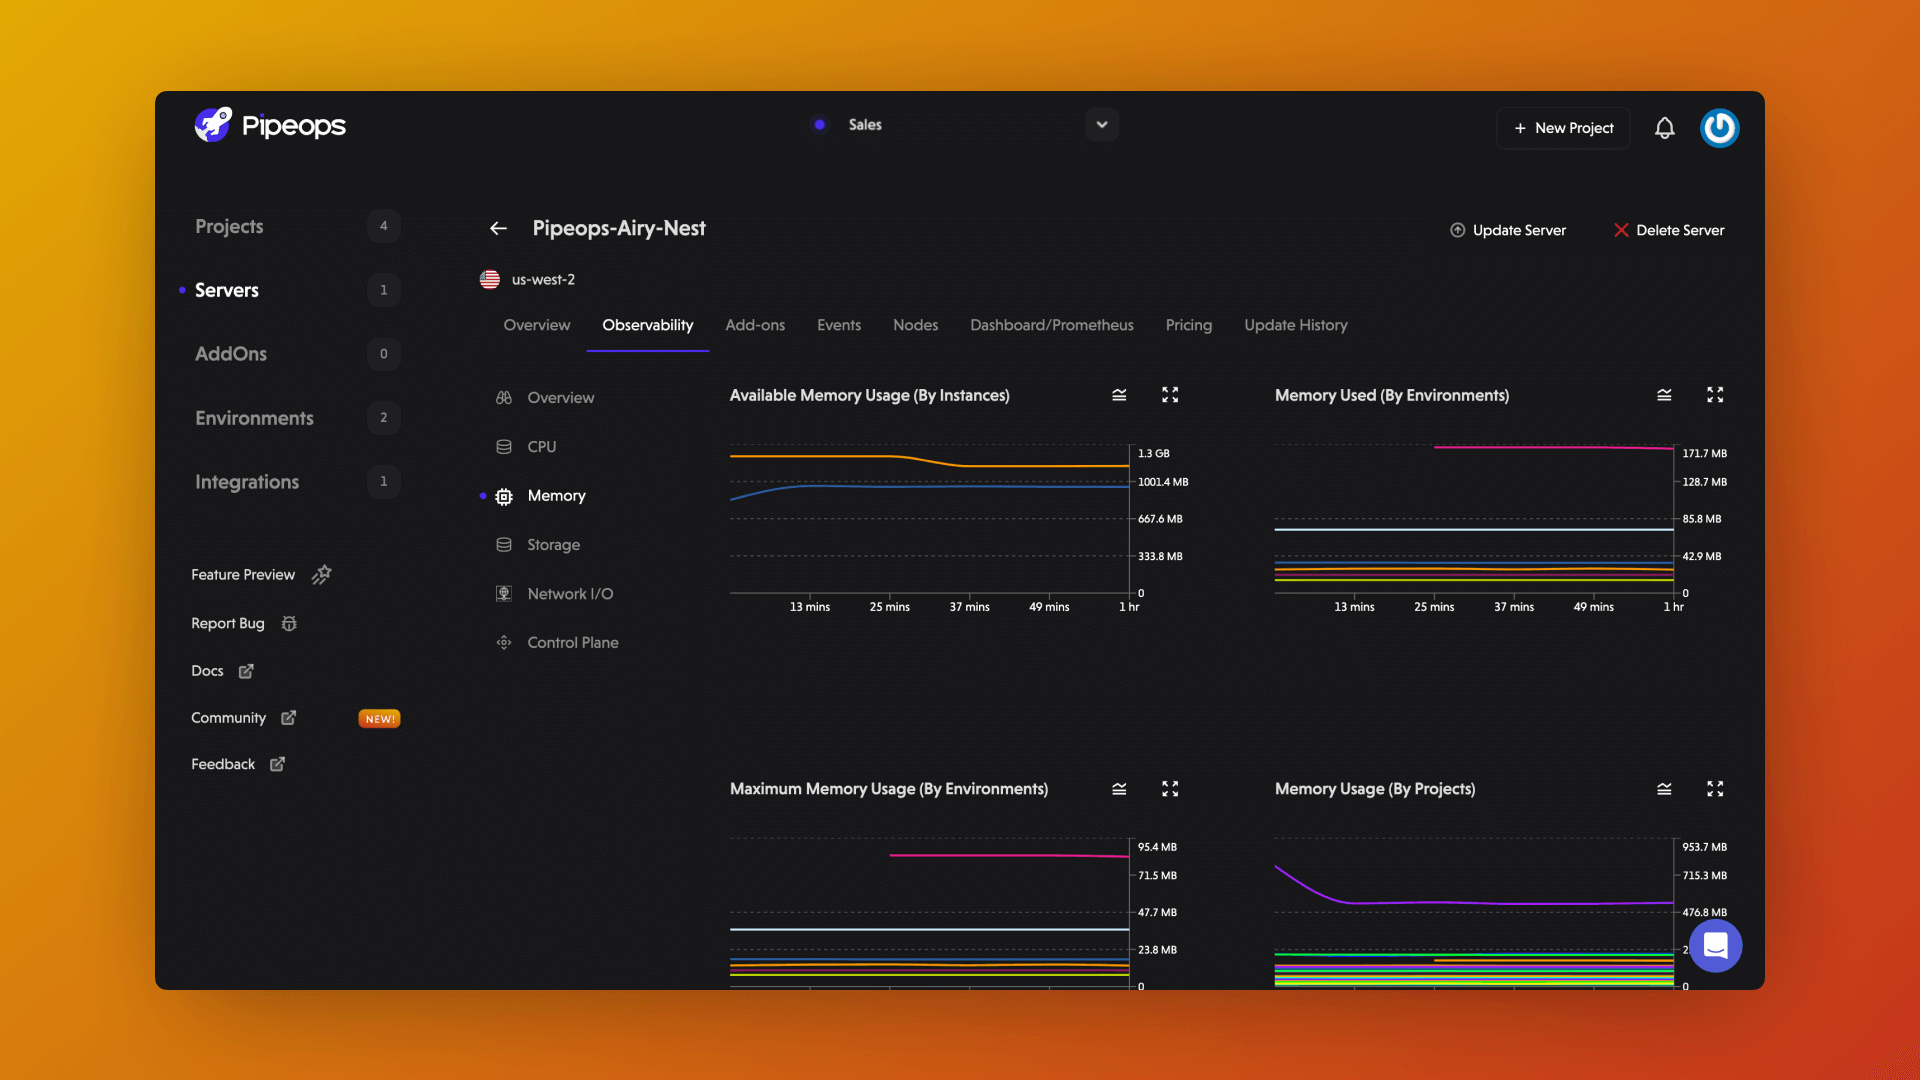
Memory Metric
The memory metric provides information about the memory usage of your server, offering visibility into how much memory your applications are utilizing. Here's an example of how the memory metric might be represented:
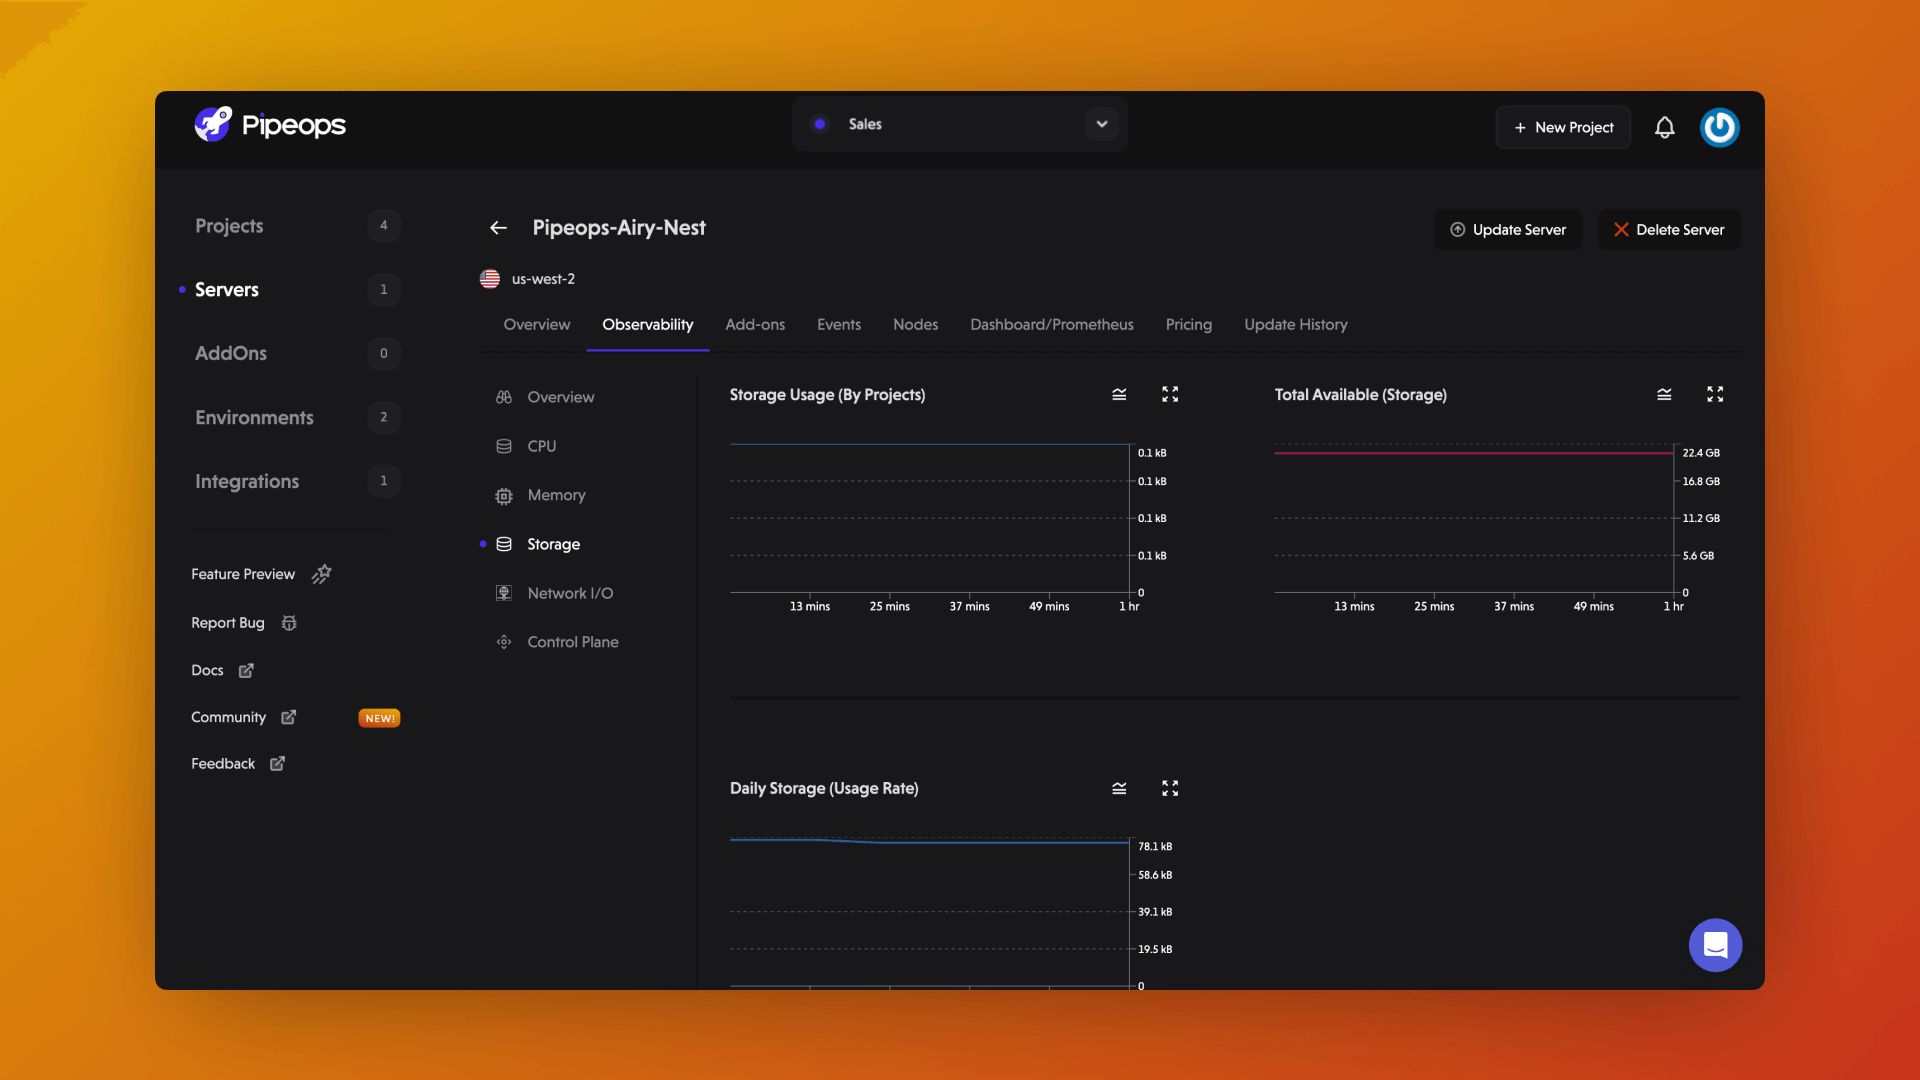
Storage Metric
The storage metric focuses on the storage usage of your server, helping you track the amount of disk space your applications occupy. Here's an example of how the storage metric might be displayed:
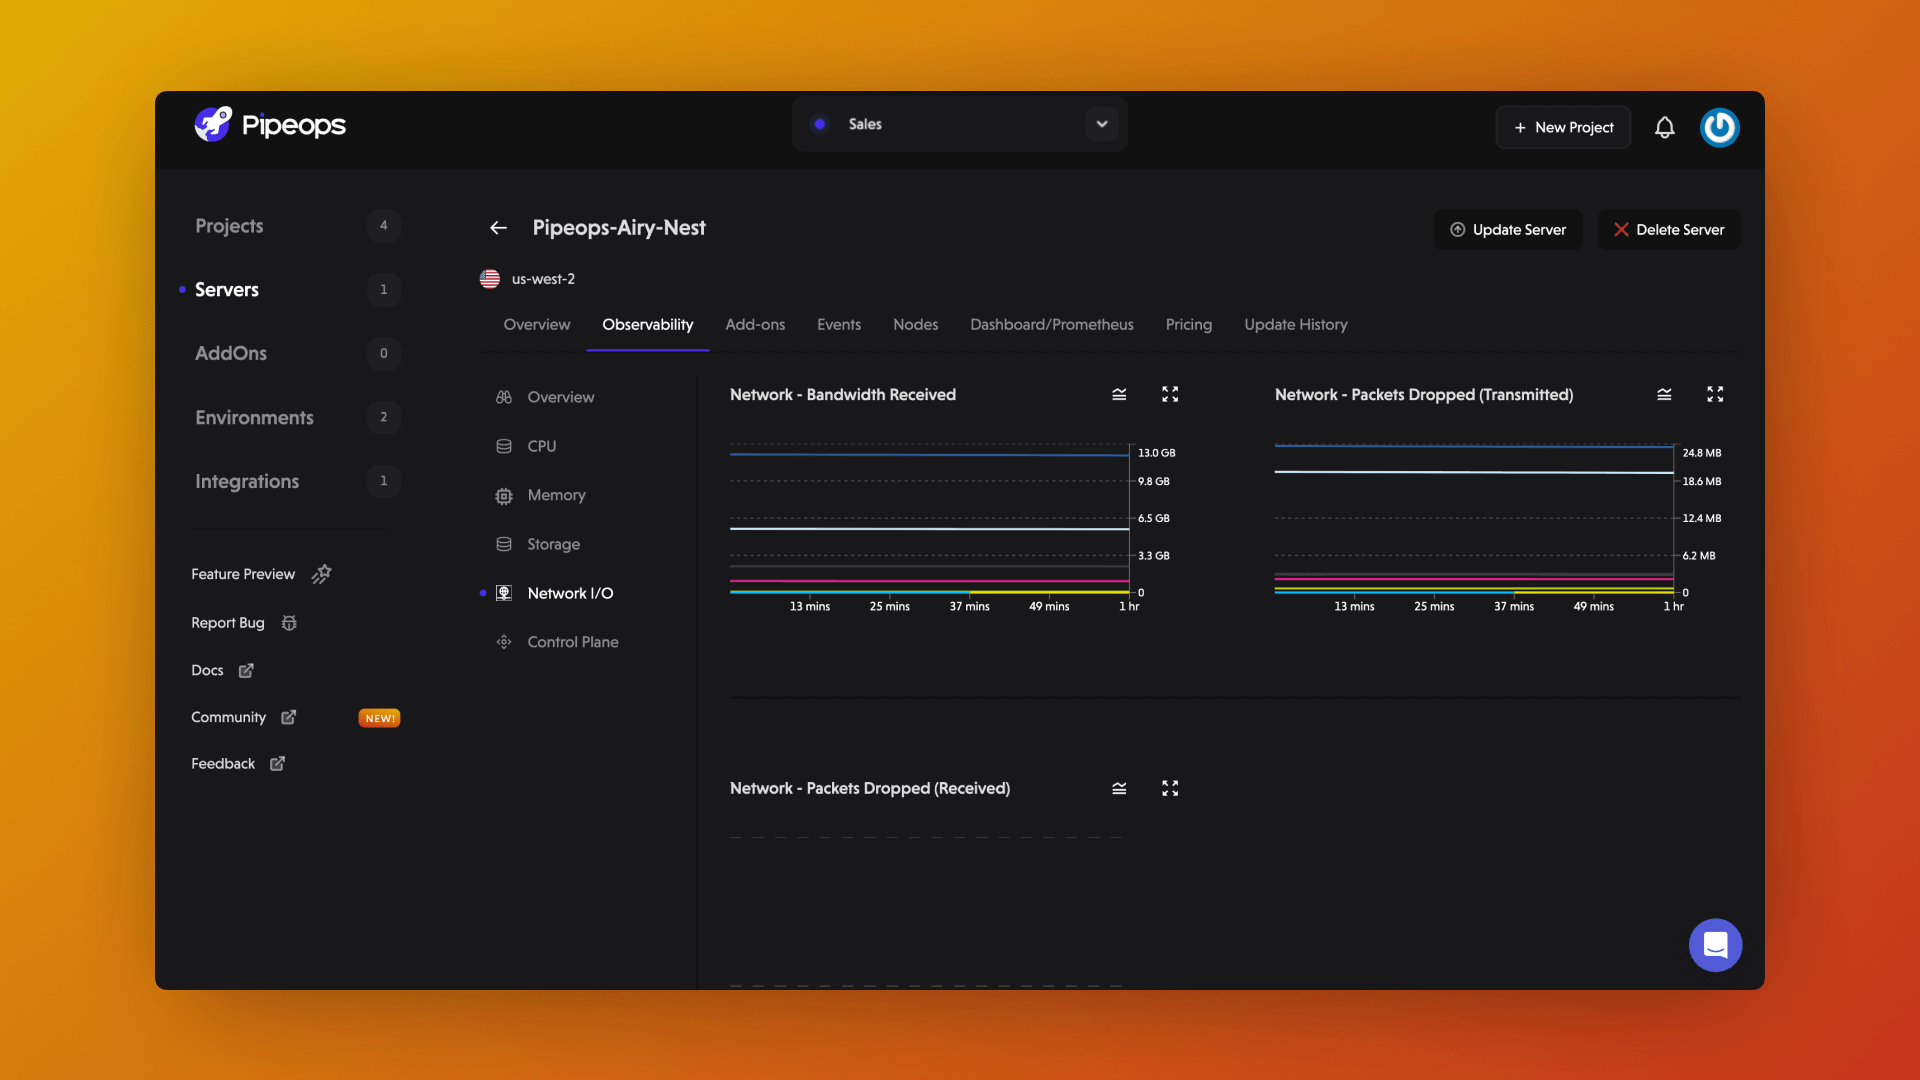
Network I/O Metric
The network I/O metric provides insights into the input and output activity of your server, offering an understanding of data transfer between your applications and external systems. Here's an example of how the network I/O metric might be visualized:
Control Plane Metric
The control plane metric provides insights into the performance of your server control plane, allowing you to monitor the health and efficiency of the control plane components managing the server. Here's an example of how it might be visualized:
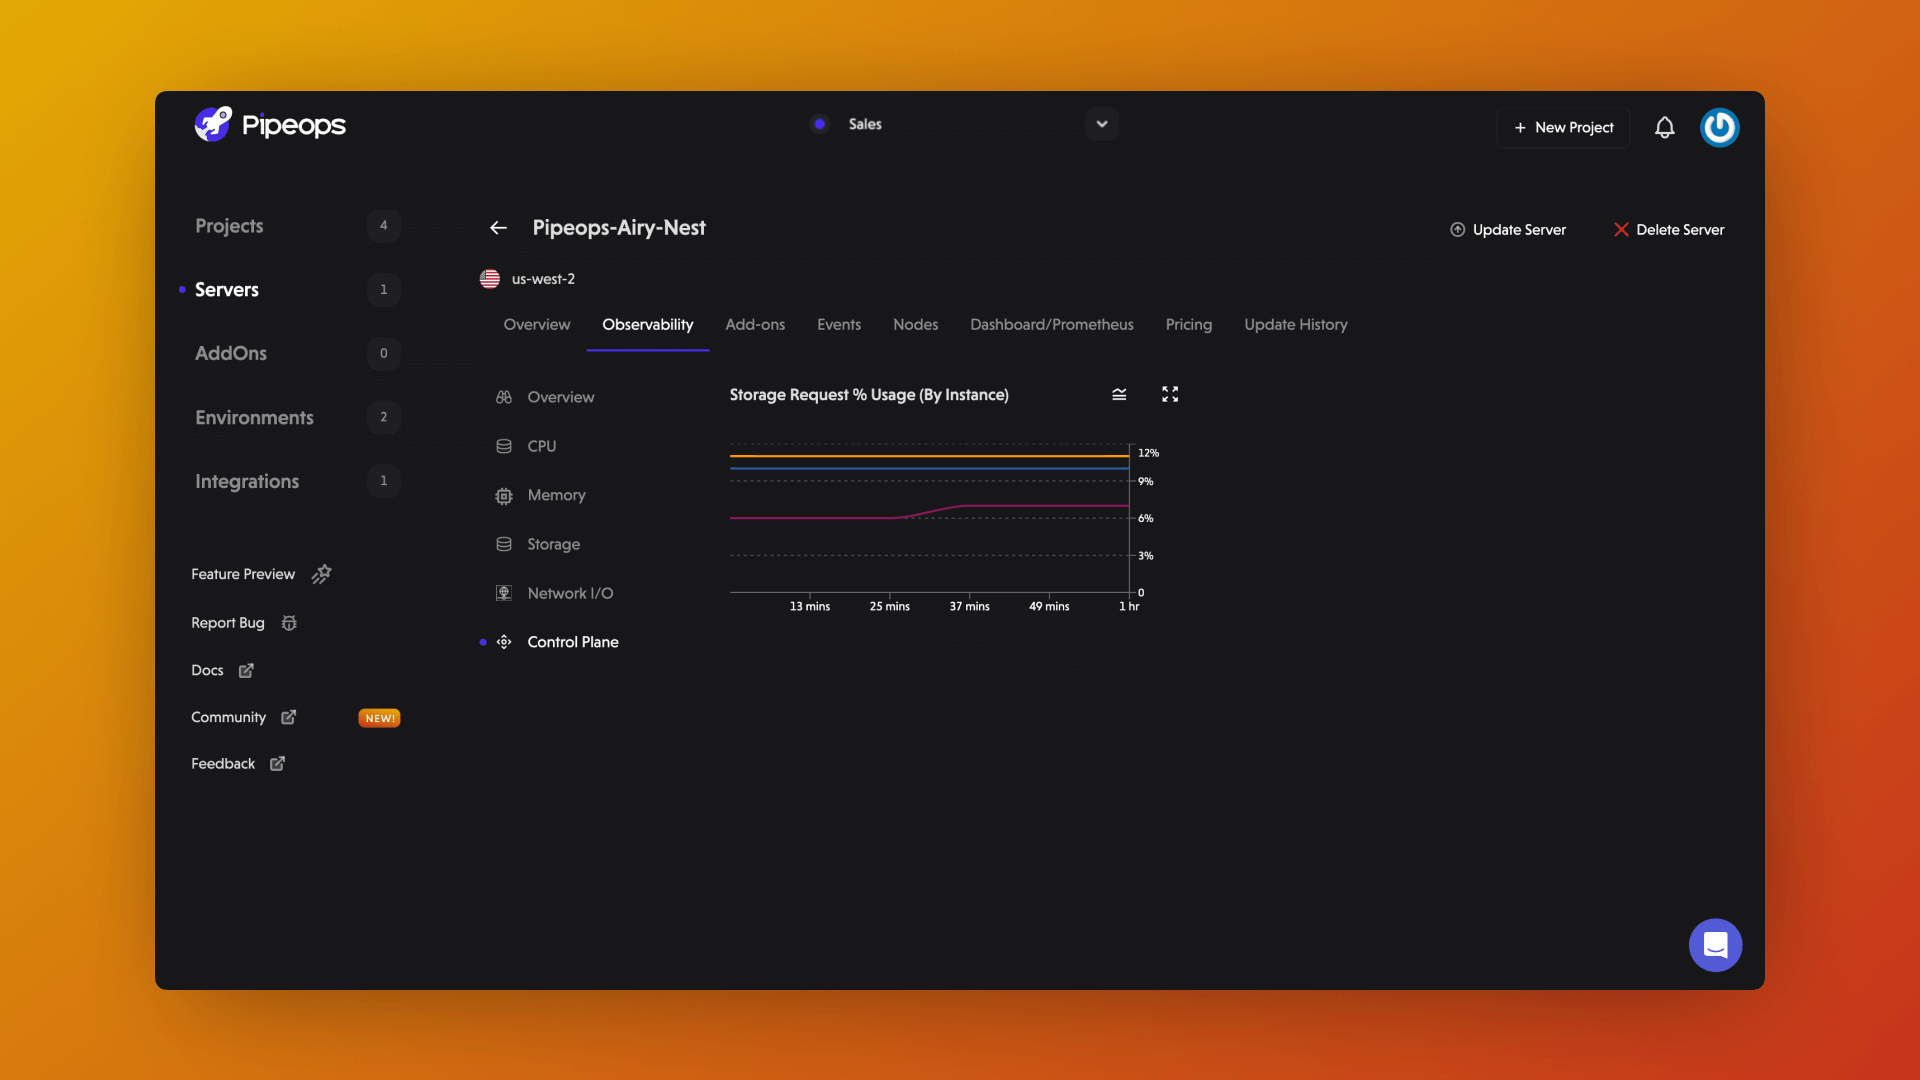
Monitoring the control plane metric enables you to identify potential issues and optimize server management. Keep a close eye on this metric to ensure smooth operation and maximize performance.
By exploring these individual metrics, you can gain a comprehensive understanding of how your server performs in different areas.
With PipeOps server observability, you have the power to monitor and analyze your server's metrics effectively. Leverage these insights to optimize performance, identify bottlenecks, and make data-driven decisions.