Add-on Metrics
The Metrics tab gives you a real-time and historical view of your add-on's performance across CPU, memory, storage, and network activity. Use these charts to spot usage trends, identify resource bottlenecks, and track how your add-on behaves over time.
Accessing Metrics
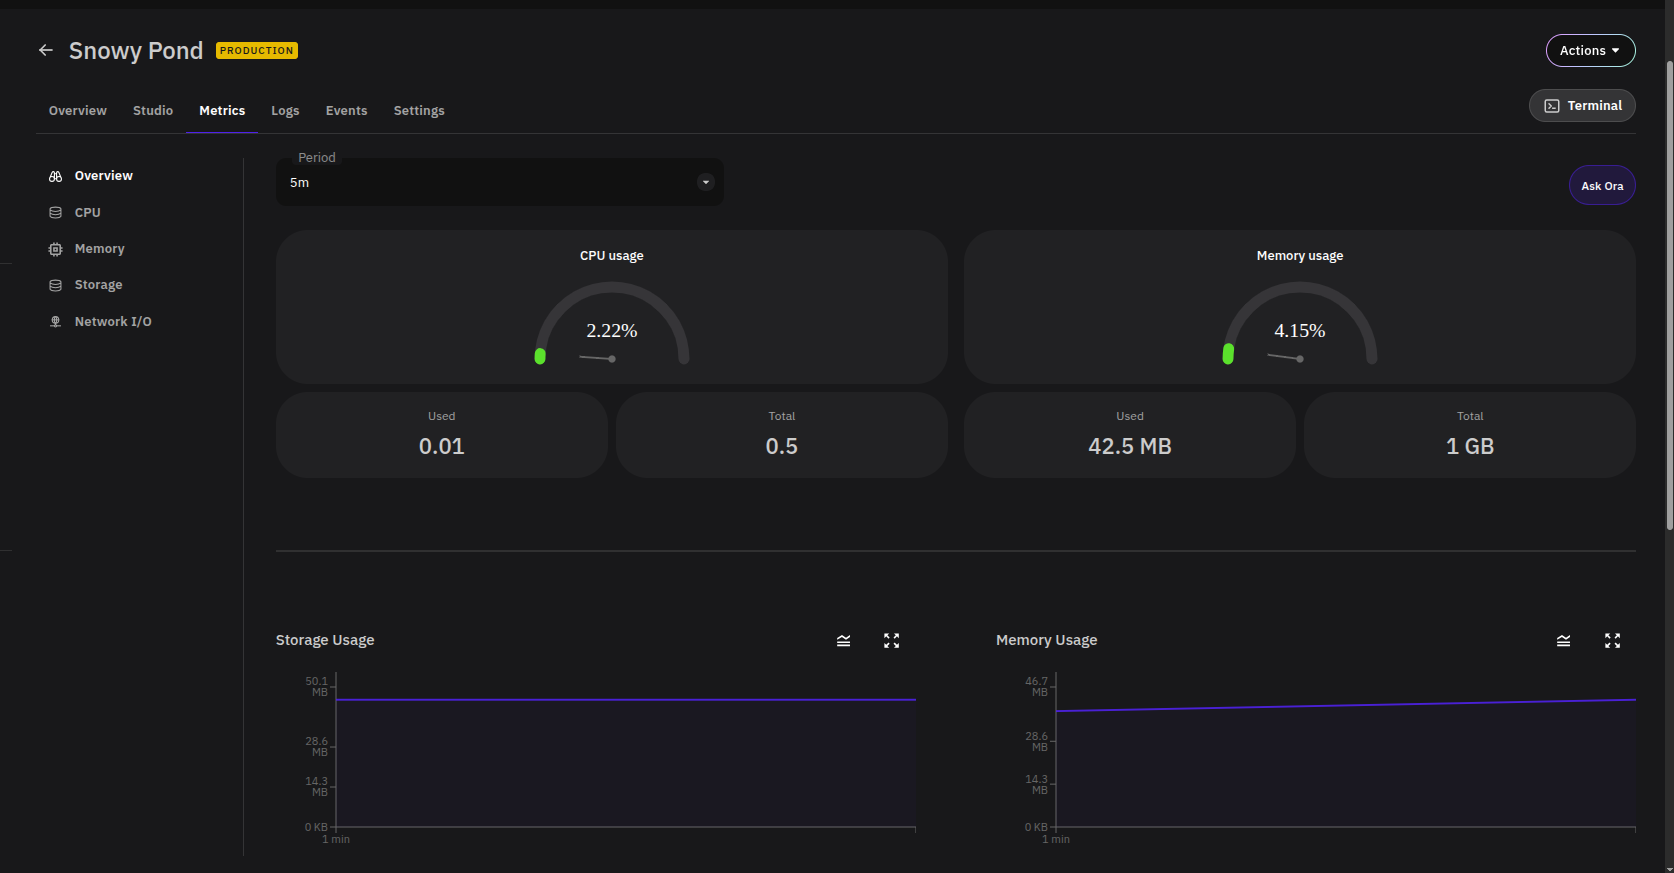
Navigate to your add-on and click the Metrics tab. The Overview section loads by default, showing a summary of all key metrics at a glance — including current CPU and memory usage gauges, used/total resource tiles, and time-series charts for storage and memory.
Filtering by Time Period
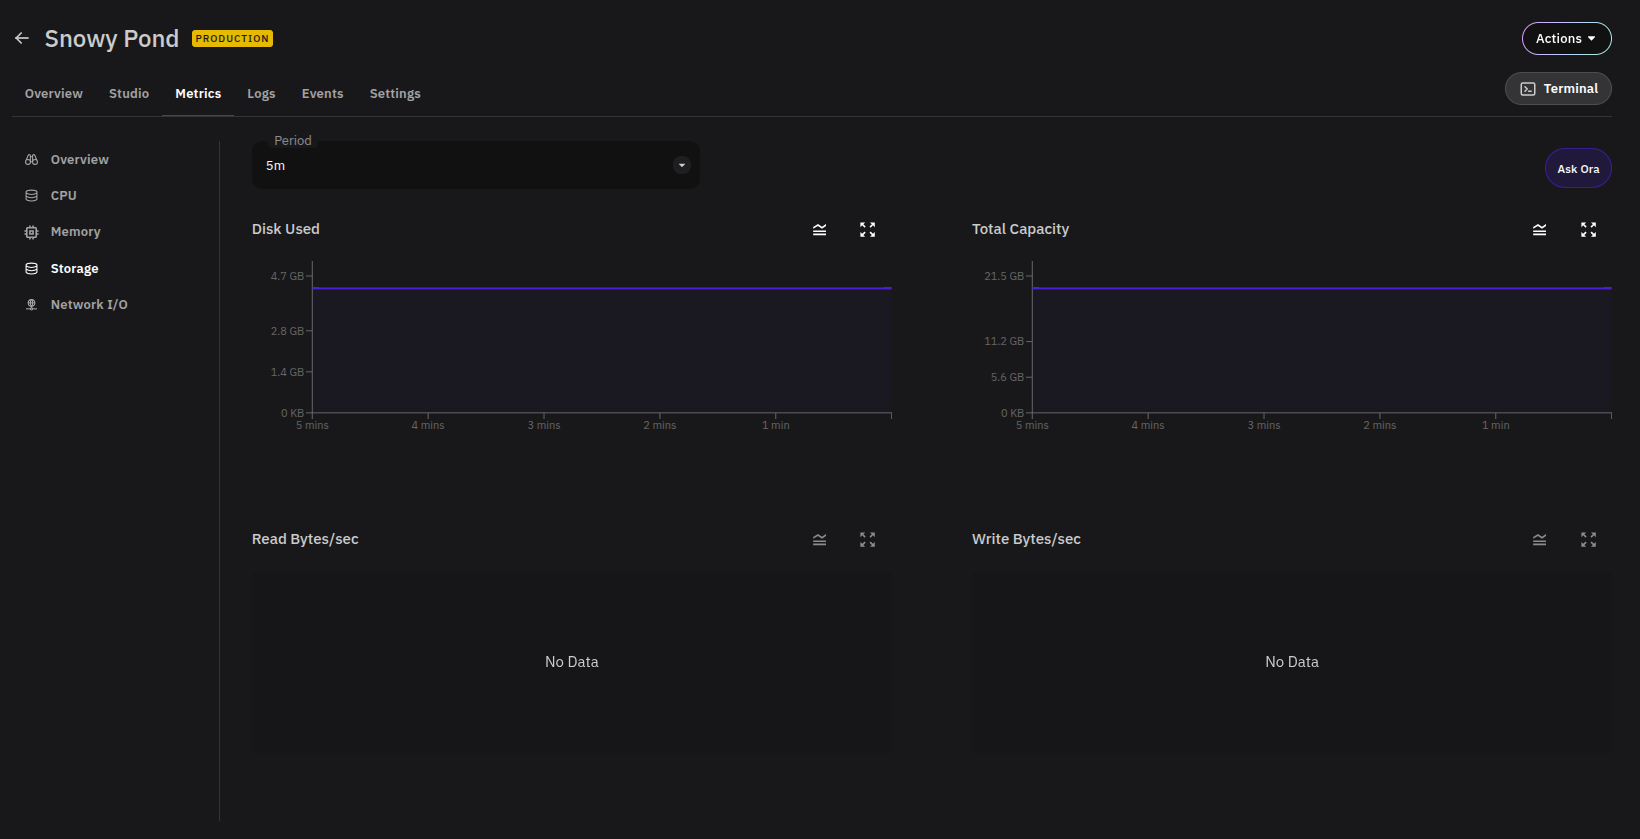
Use the Period dropdown at the top of the page to filter all charts by a relative time window (e.g. 5m, 15m, 1h). All charts update simultaneously when the period changes.
Metric Sections
Use the left sidebar to navigate between metric categories. Each section provides a dedicated time-series chart for that resource.
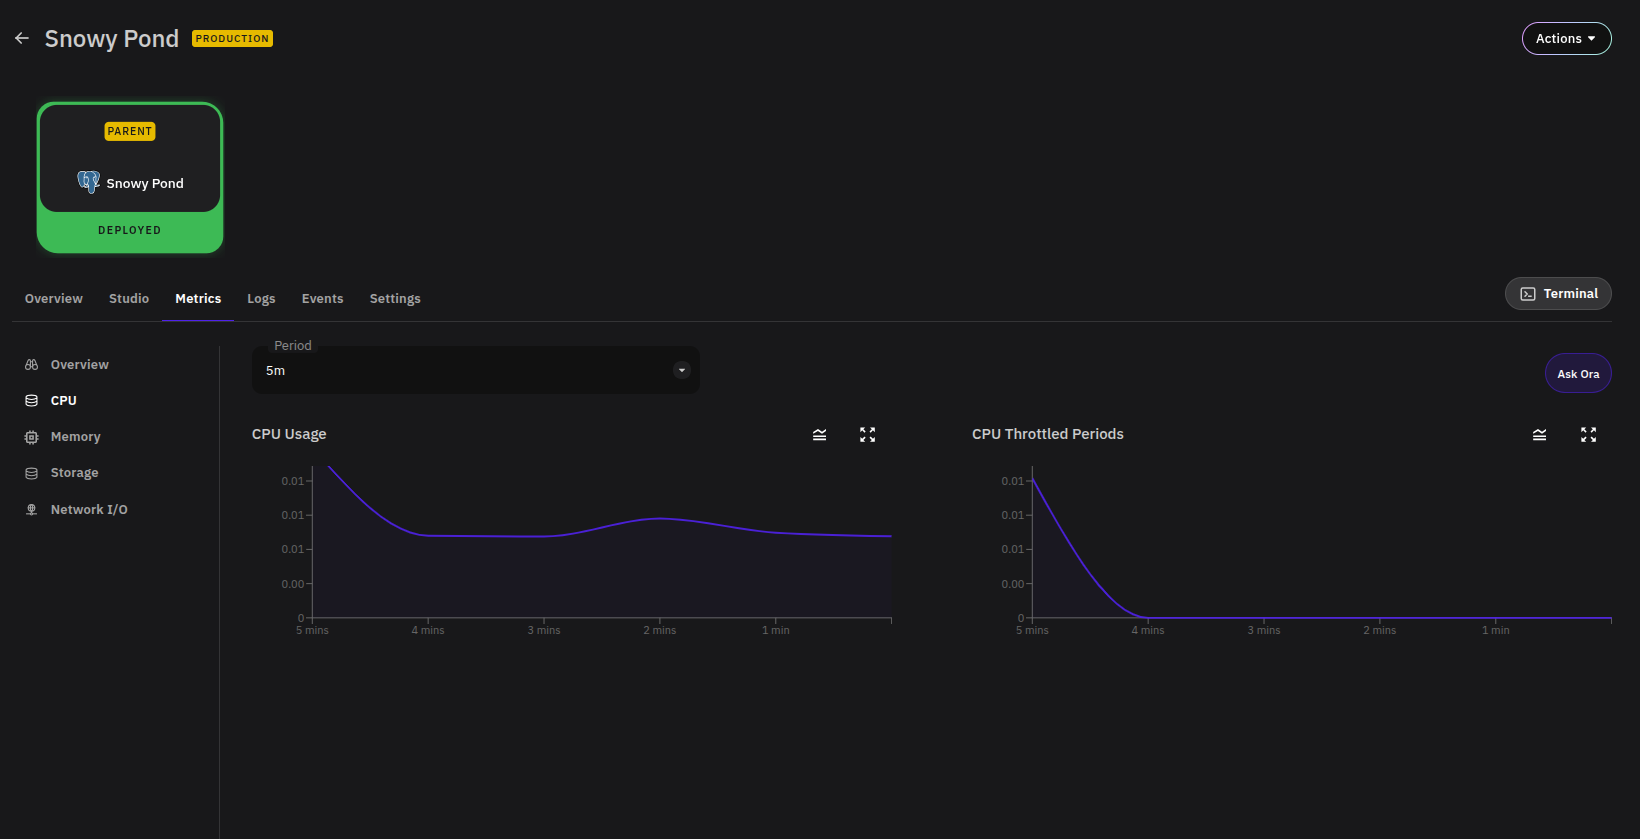
CPU
Shows the processing power consumed by your add-on over the selected period. Use this to identify compute spikes or sustained high load that may require scaling.
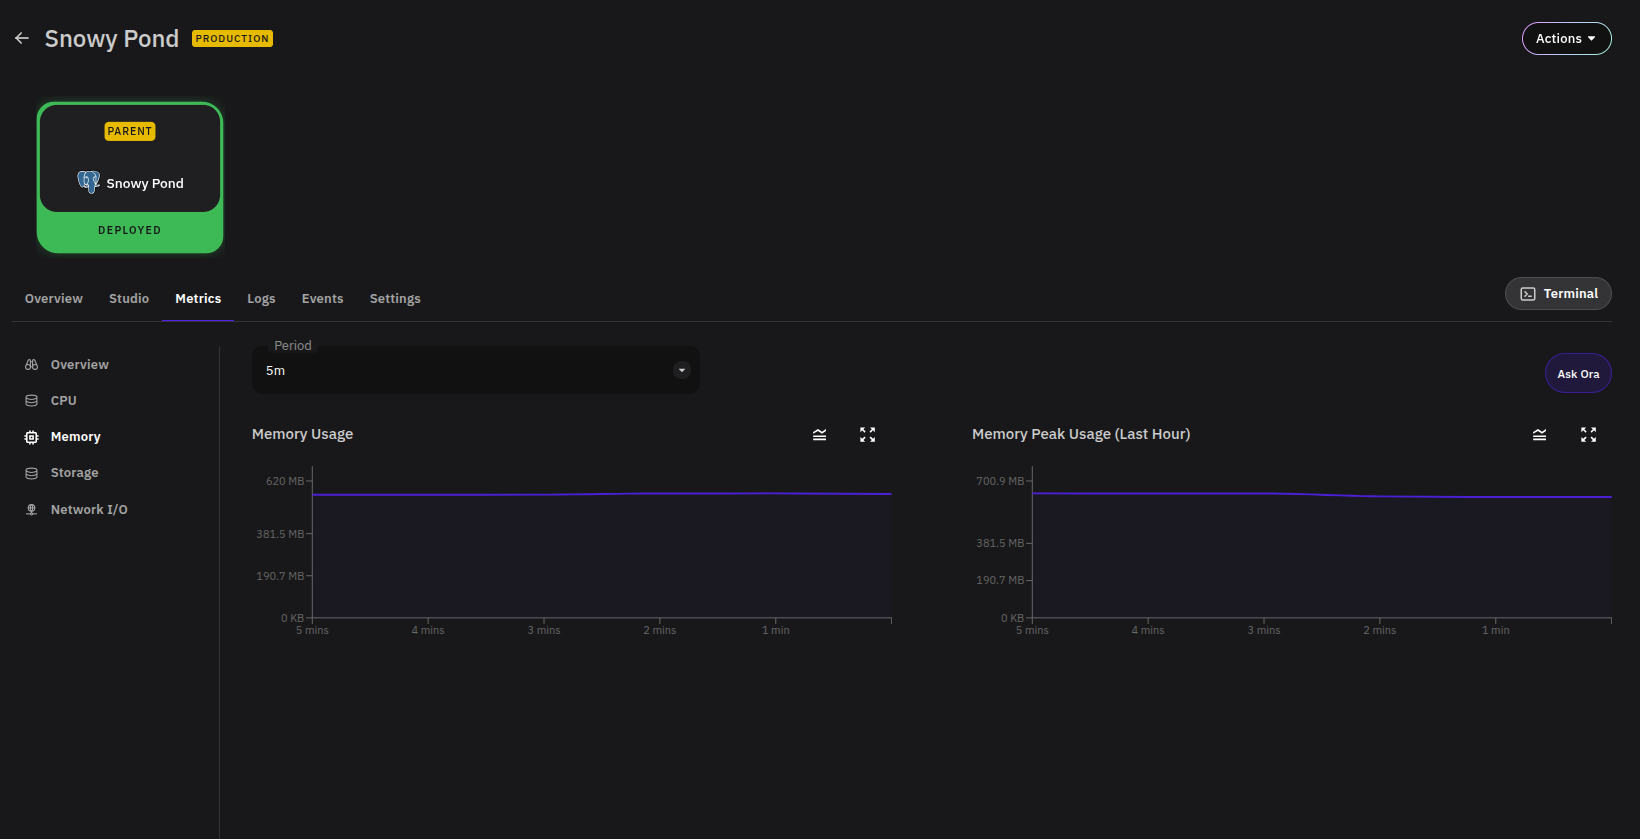
Memory
Shows how much memory your add-on is consuming over time. The Overview also surfaces a Restart Count chart — a flat line at zero indicates no unexpected restarts. Rising memory that doesn't level off may indicate a memory leak or a need to increase your resource allocation.
Storage
Tracks disk space usage over time. Particularly useful for database add-ons where storage is expected to grow steadily. Monitor this to avoid running out of disk space unexpectedly.
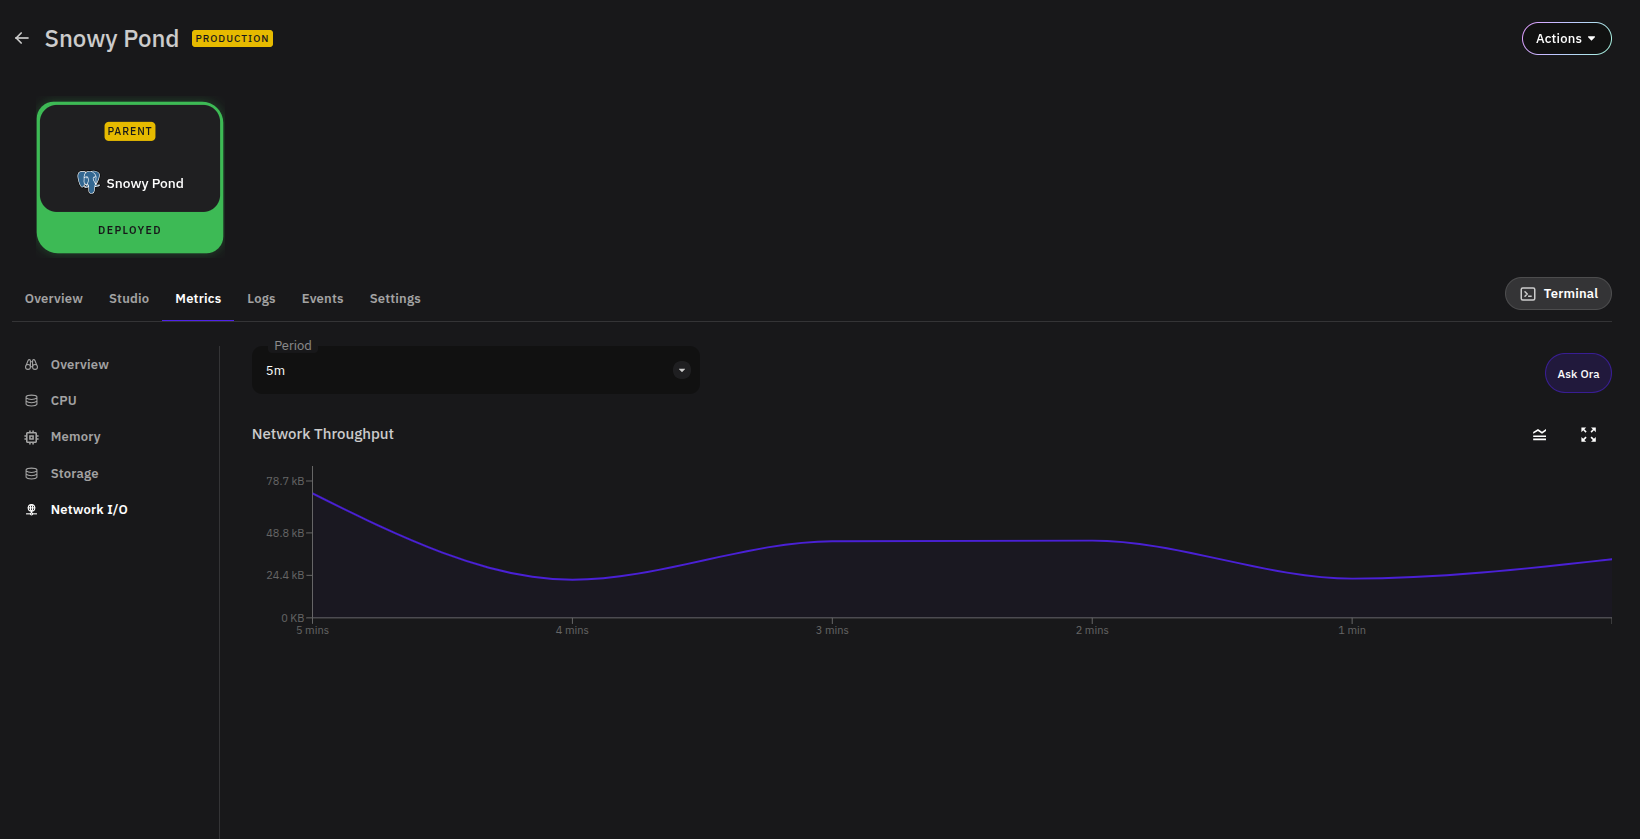
Network I/O
Shows inbound (Data Received) and outbound (Data Sent) transfer activity over time. Use this to understand traffic patterns and detect unusual spikes in data transfer.