Logs And Events
The Logs and Events tabs give you visibility into your add-on's runtime behaviour and deployment activity. Use them together to troubleshoot issues, monitor performance, and trace the sequence of infrastructure events.
Logs
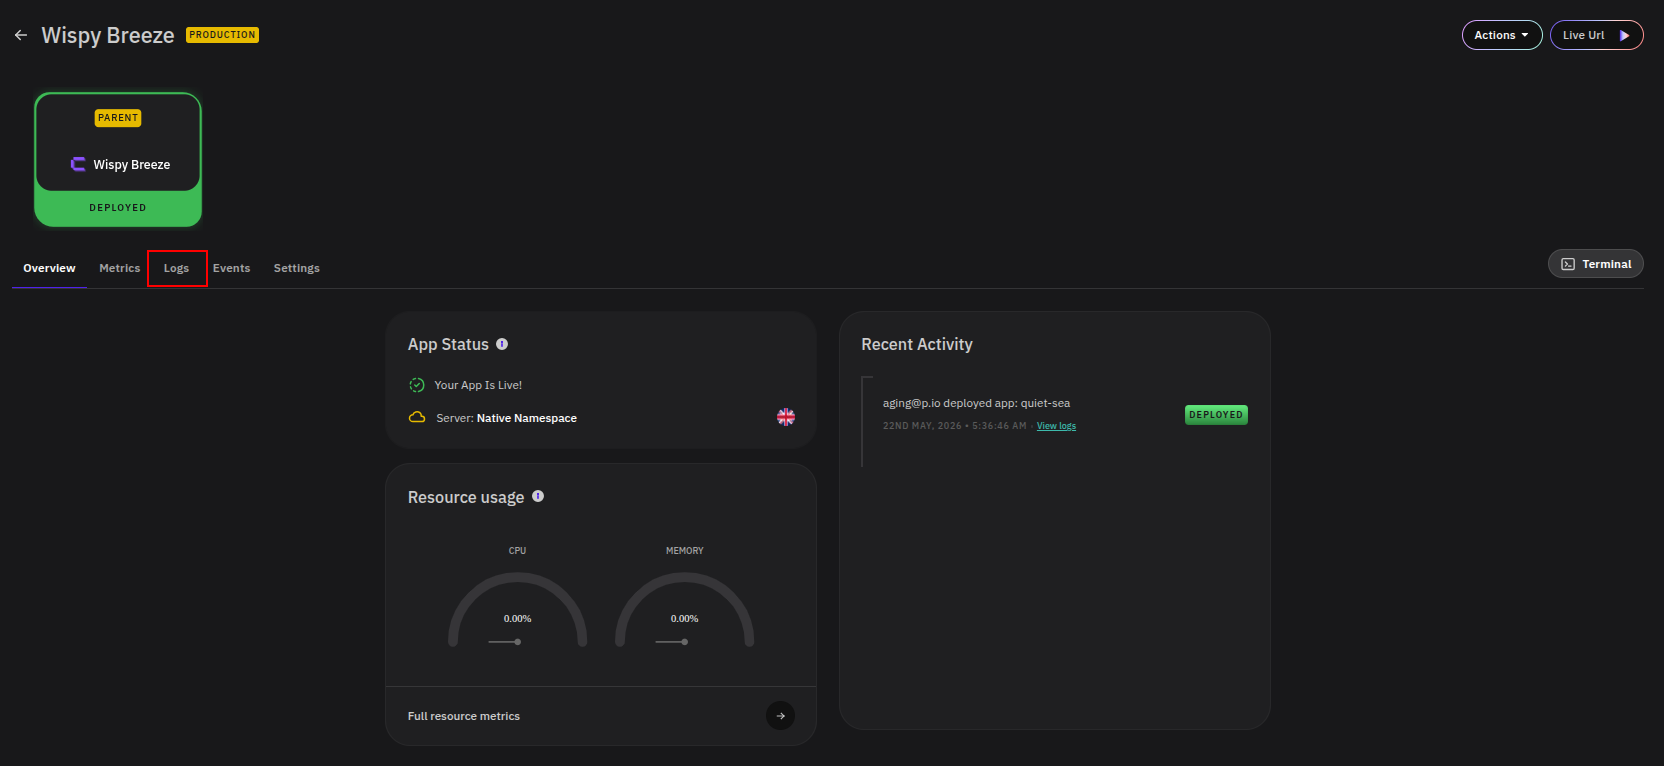
Navigate to your add-on and click the Logs tab to view a real-time stream of output from your add-on's container.
Filtering and Search
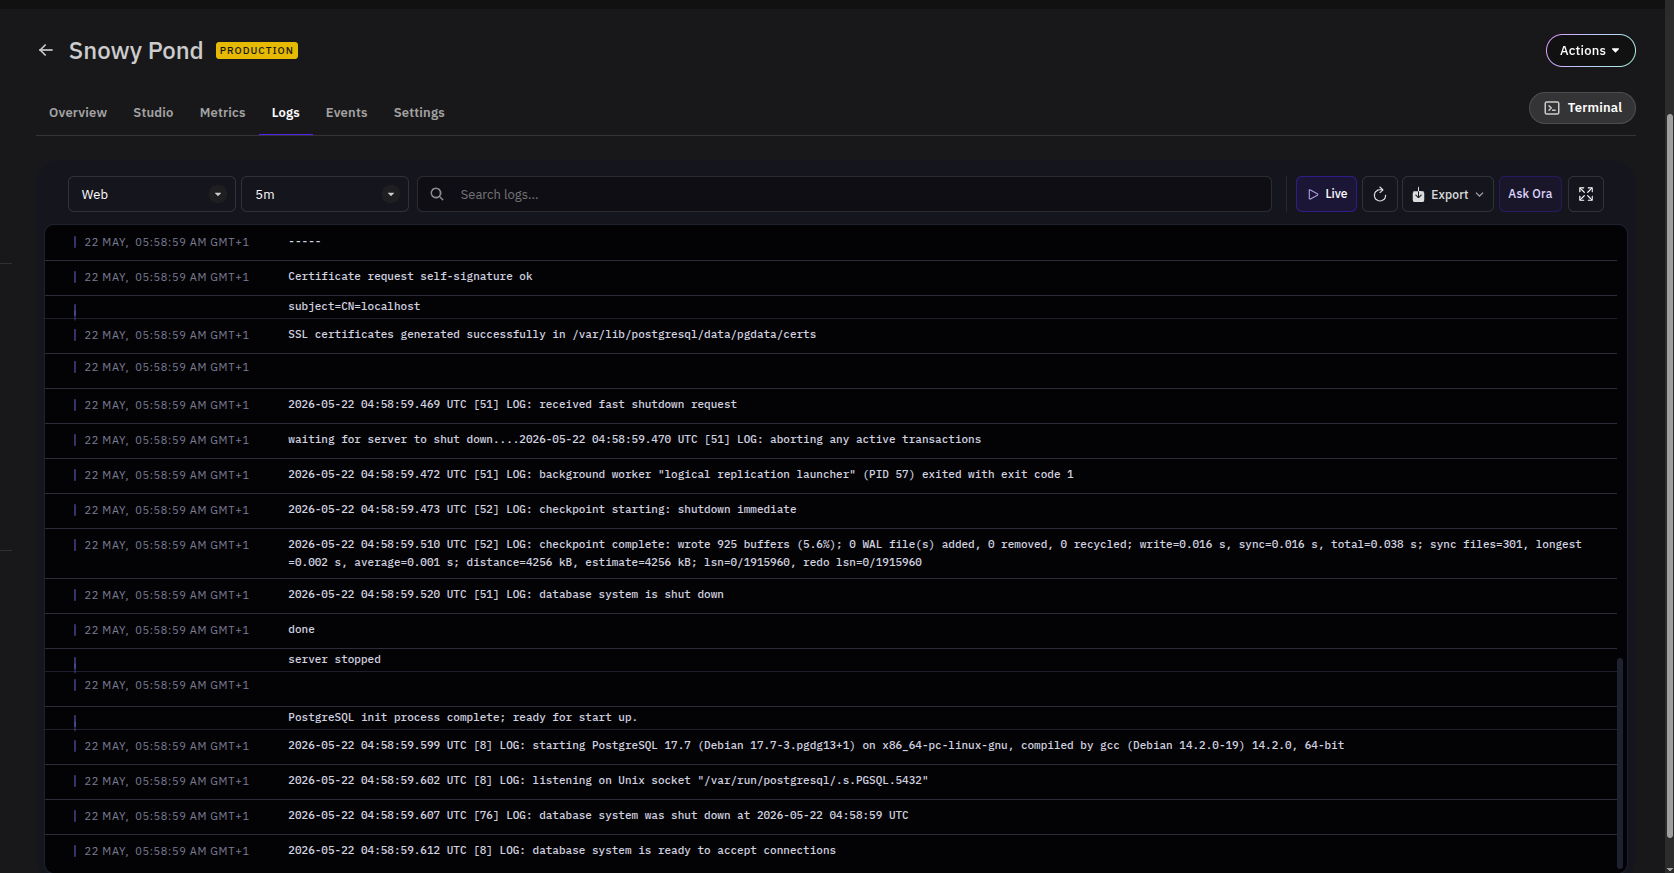
- Source — Select the log source (e.g.
Web) from the dropdown on the left. - Period — Filter logs by a relative time window such as
5mor1h. - Search — Use the search bar to find specific log entries by keyword.
Toolbar Actions
| Action | Description |
|---|---|
| Live | Streams new log entries in real time as they are generated. |
| Refresh | Manually reloads the log view. |
| Export | Downloads the current log output. |
| Ask Ora | Opens the Ora AI assistant for help interpreting logs. |
| Fullscreen | Expands the log view to fill the screen. |
Events
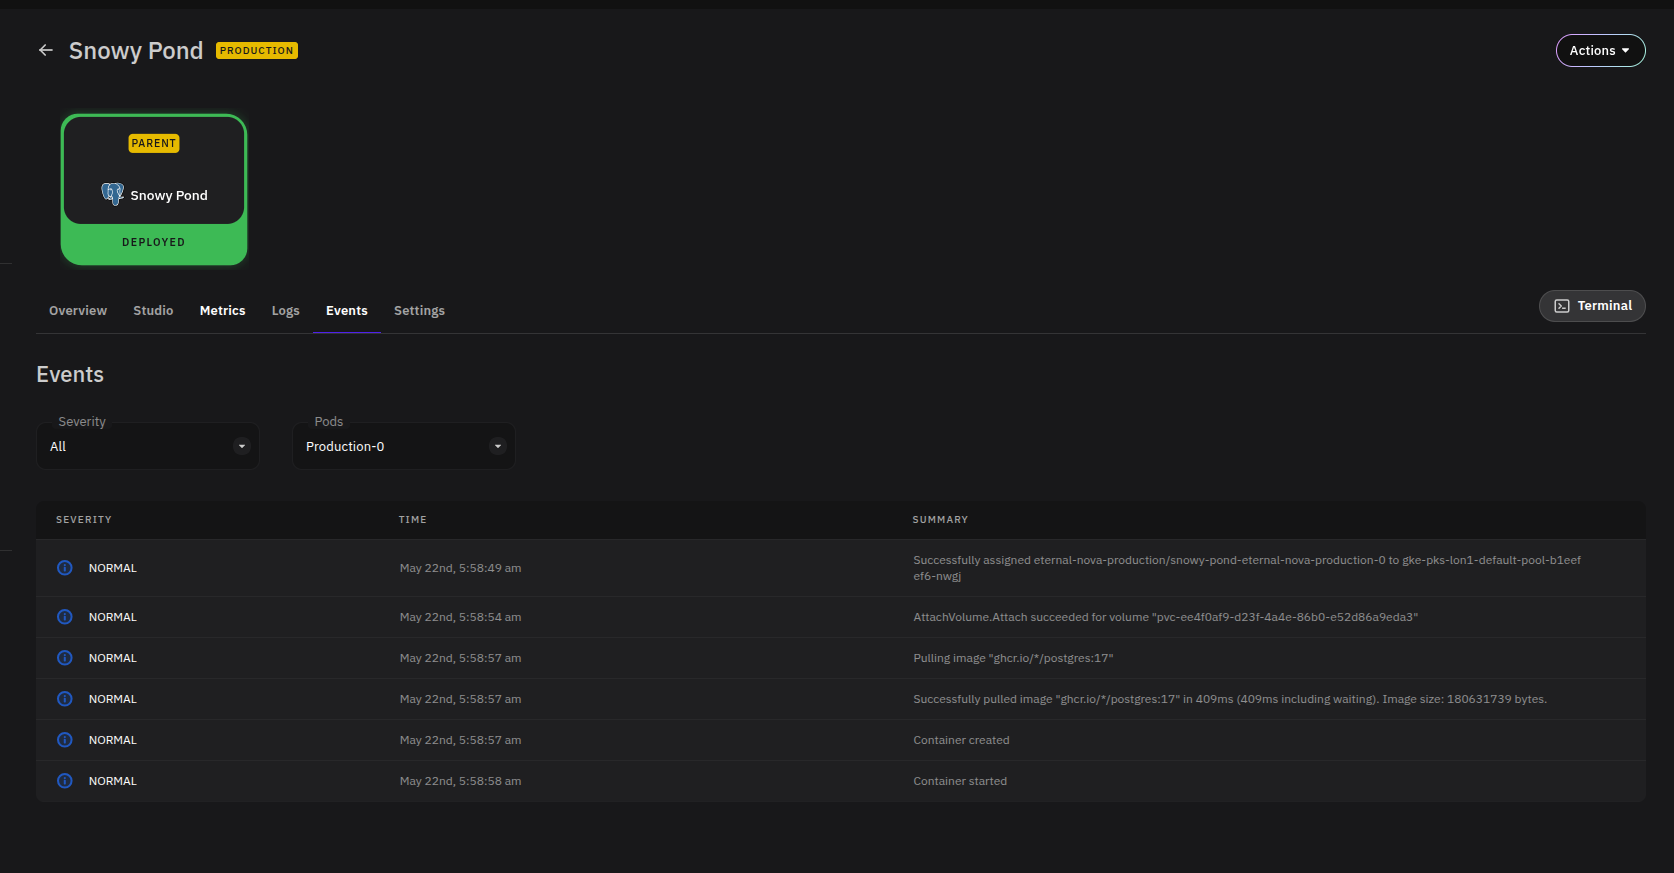
Navigate to your add-on and click the Events tab to view a timestamped record of infrastructure-level activity, such as pod scheduling, volume attachment, image pulls, and container lifecycle changes.
Filtering
- Severity — Filter events by severity level. Available options include
All,Normal, andWarning. Normal events reflect expected system activity; warnings indicate conditions that may need attention. - Pods — Scope the event list to a specific pod (e.g.
Production-0) when your add-on runs multiple replicas.
Reading Events
Each event entry shows three fields:
- Severity — The event classification (
NormalorWarning). - Time — When the event occurred.
- Summary — A short description of what happened, such as
Container startedorAttachVolume.Attach succeeded.
A typical healthy deployment produces a sequence of Normal events: pod assigned → volume attached → image pulled → container created → container started.