Addon Metrics
Overview
This documentation guides you through the process of accessing and exploring metrics for your deployed add-on using PipeOps. With PipeOps, you can gain valuable insights into the performance and behavior of your add-ons.
Accessing Add-on Metrics
To view the metrics for your add-on, follow these steps:
- Navigate to your add-on in PipeOps.
- Click on the Metrics tab in the navigation menu.
This will open the Add-on Metrics Overview page, where you can monitor key performance indicators at a glance.
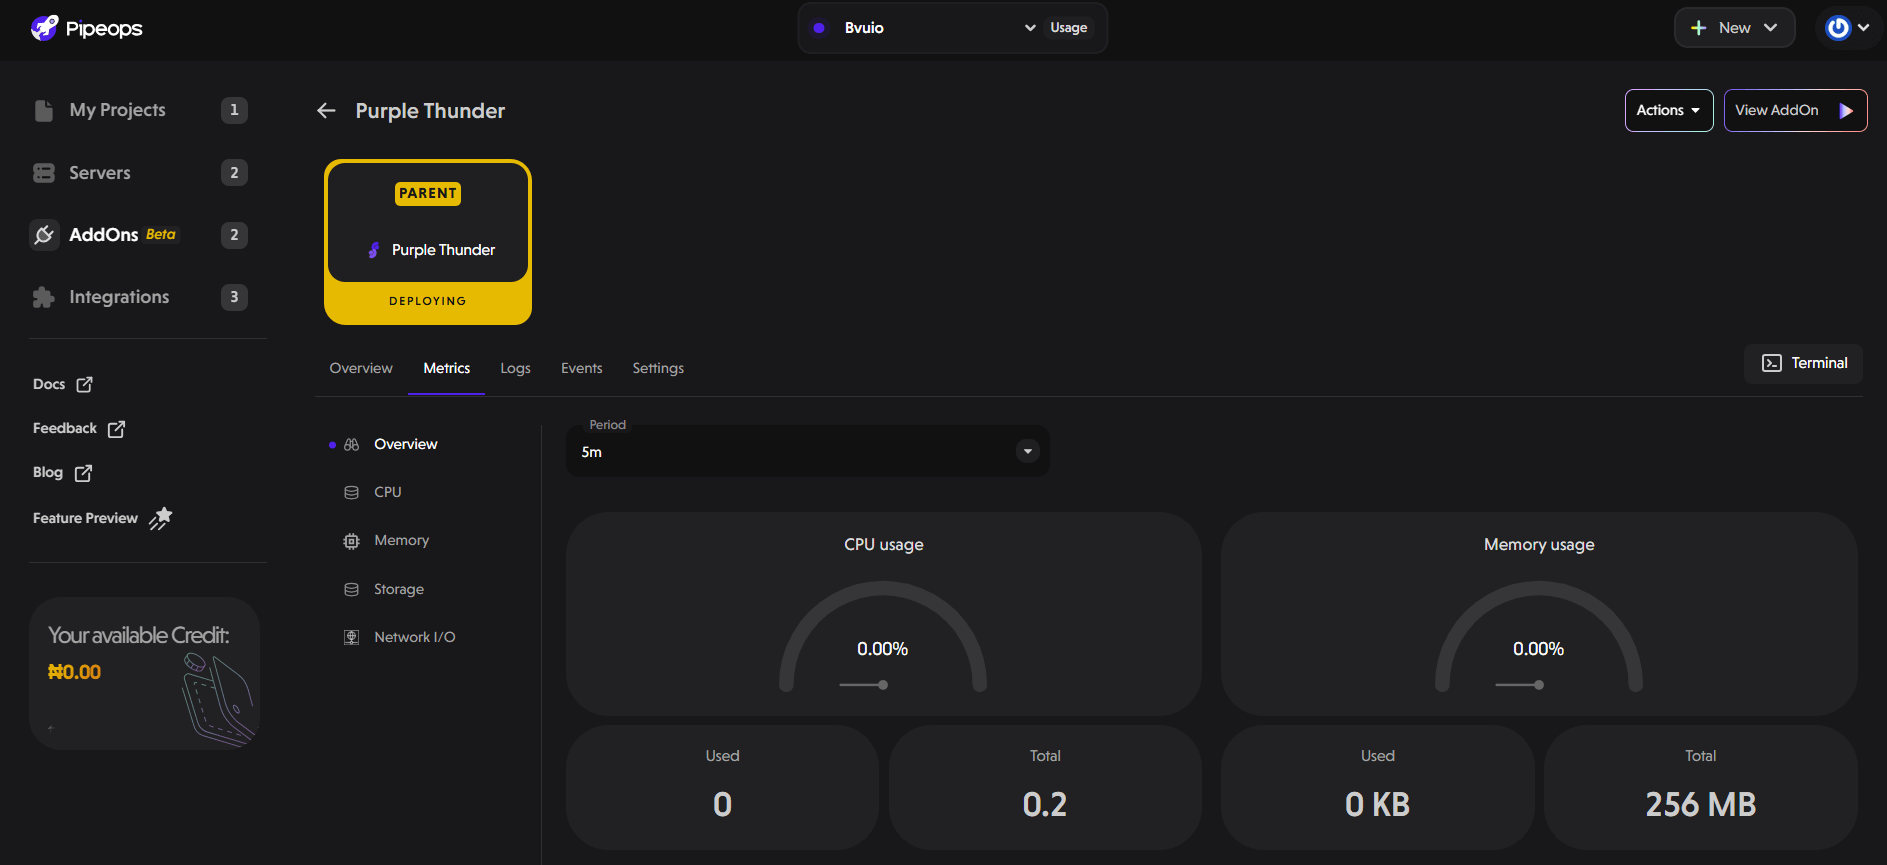
The image above illustrates the add-on metrics overview, offering a quick glimpse of how your add-on is performing in various metrics.
Exploring Individual Metrics
PipeOps allows you to dive deeper into the details of each metric. You can filter your results by time period. Use the Period dropdown menu to select a relative time (e.g., 15 minutes, 1 hour, etc.) or a date range. Let's explore some key metrics available:
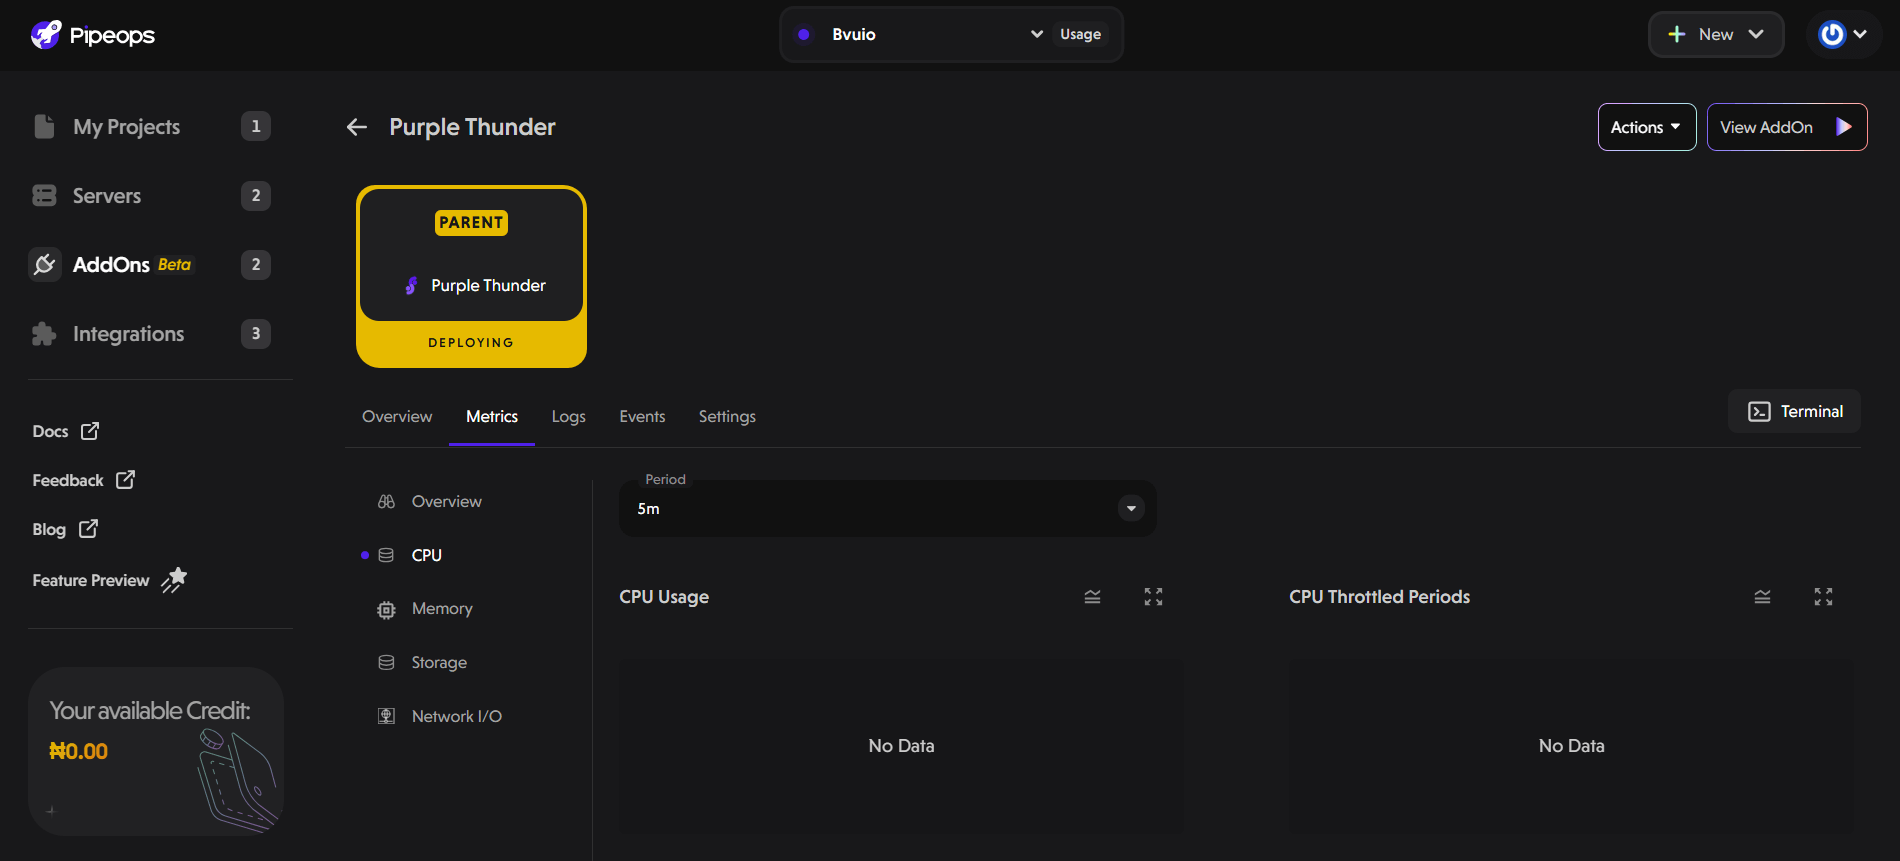
CPU Metric
The CPU metric provides insights into the CPU usage of your add-on, helping you understand the processing power consumed by your application. Here's an example of how the CPU metric might be visualized:
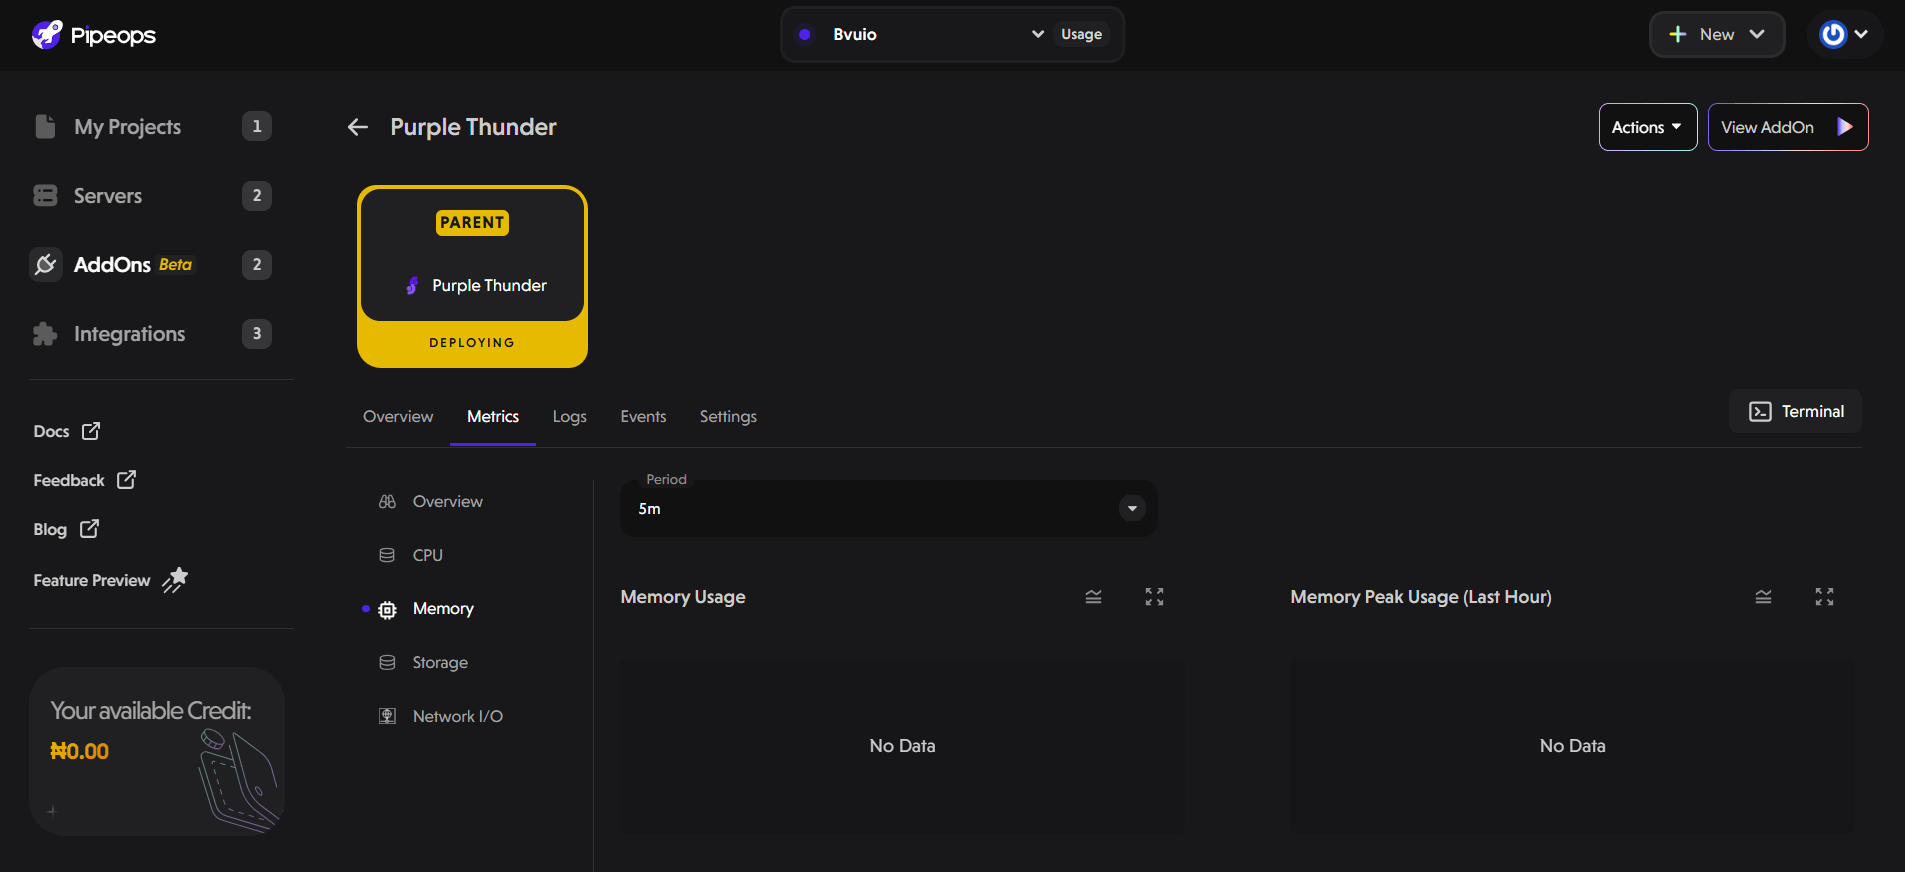
Memory Metric
The memory metric provides information about the memory usage of your add-on, offering visibility into how much memory your application is utilizing. Here's an example of how the memory metric might be represented:
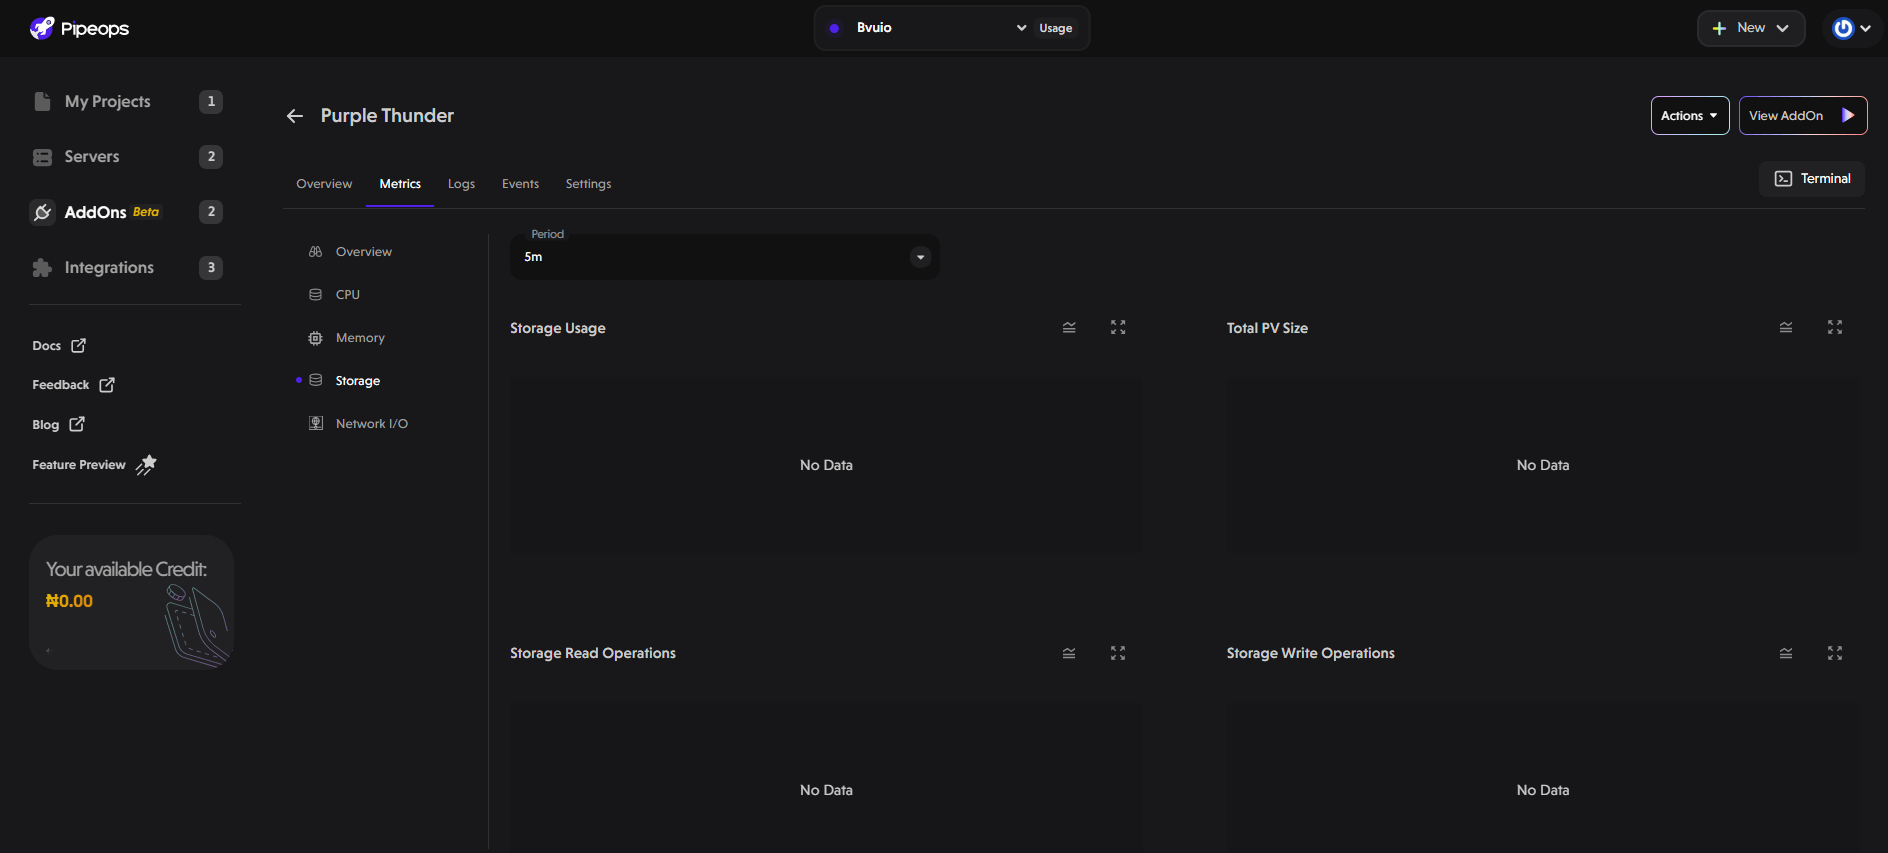
Storage Metric
The storage metric focuses on the storage usage of your add-on, helping you track the amount of disk space your application occupies. Here's an example of how the storage metric might be displayed:
Network I/O Metric
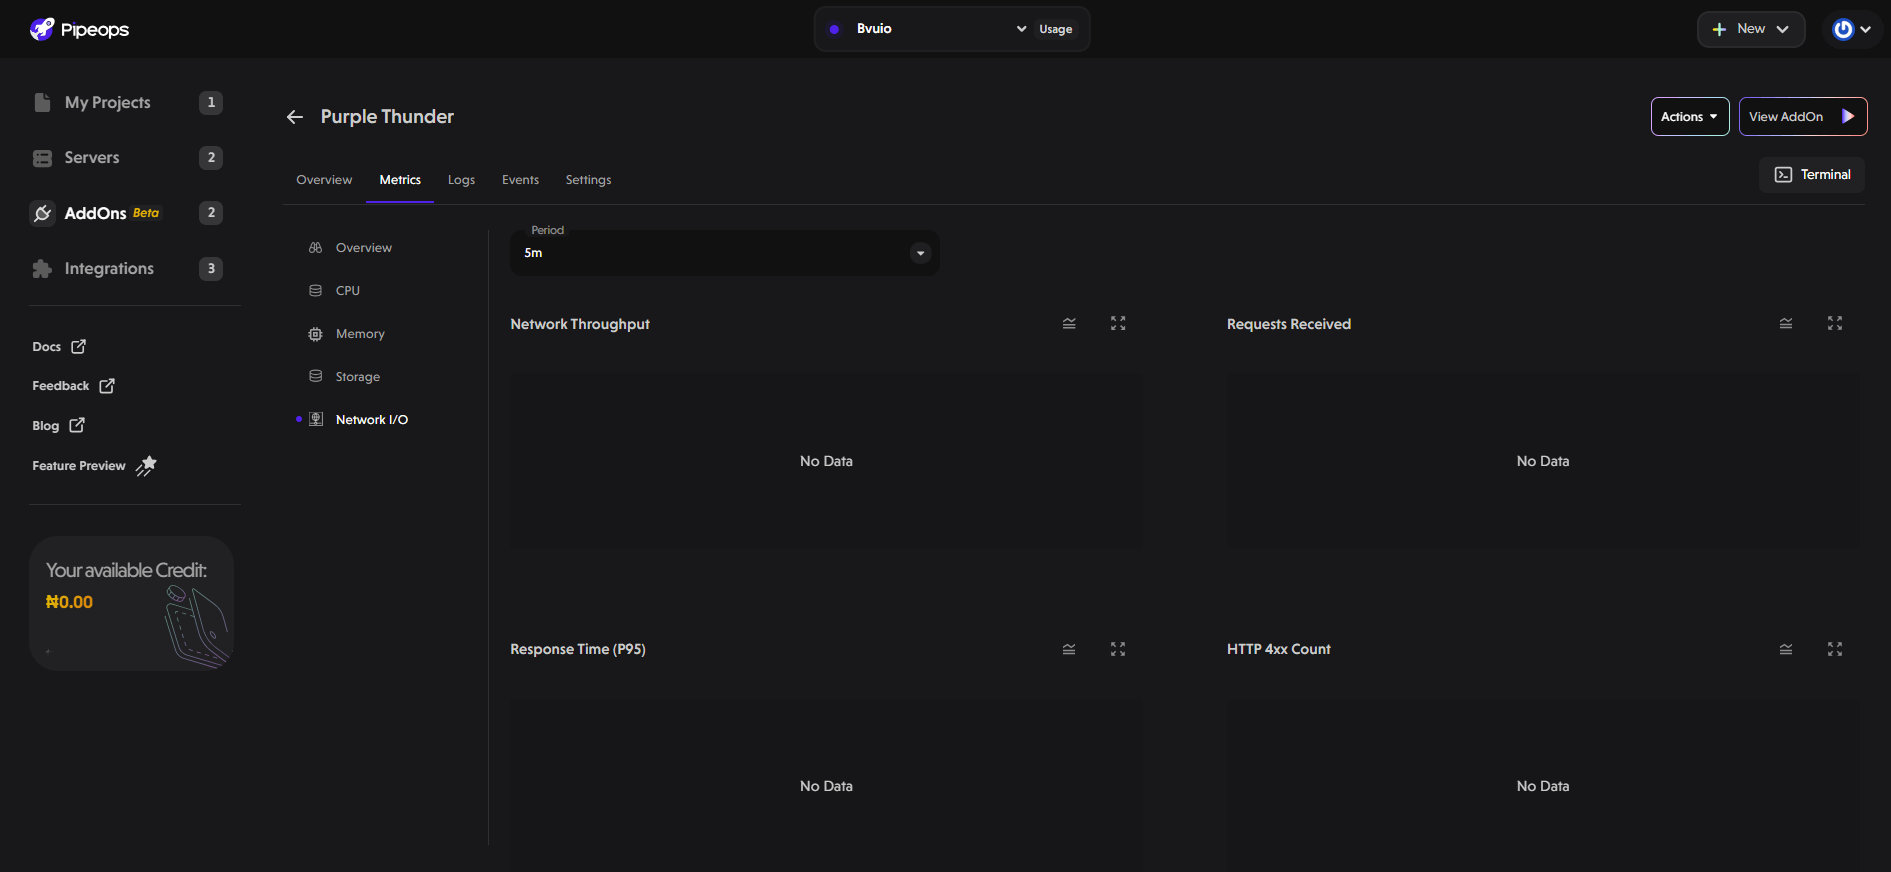
The network I/O metric provides insights into the input and output activity of your add-on, offering an understanding of data transfer between your application and external systems.
The Network I/O section provides insights into data transfer and HTTP requests handled by your add-on.
Here's an example of how the network I/O metric might be visualized:
By exploring these individual metrics, you can gain a comprehensive understanding of how your add-on performs in different areas.
With PipeOps add-on metrics, you have the power to monitor and analyze your add-on metrics effectively. Leverage these insights to optimize performance, identify bottlenecks, and make data-driven decisions.