Add-on Overview
The Add-on Overview page in PipeOps provides essential information about your deployed add-ons. Upon successfully deploying an add-on, or if you select an already installed add-on from the installed Add-ons page, you will be navigated to the overview section.
Non-Database Add-on Overview

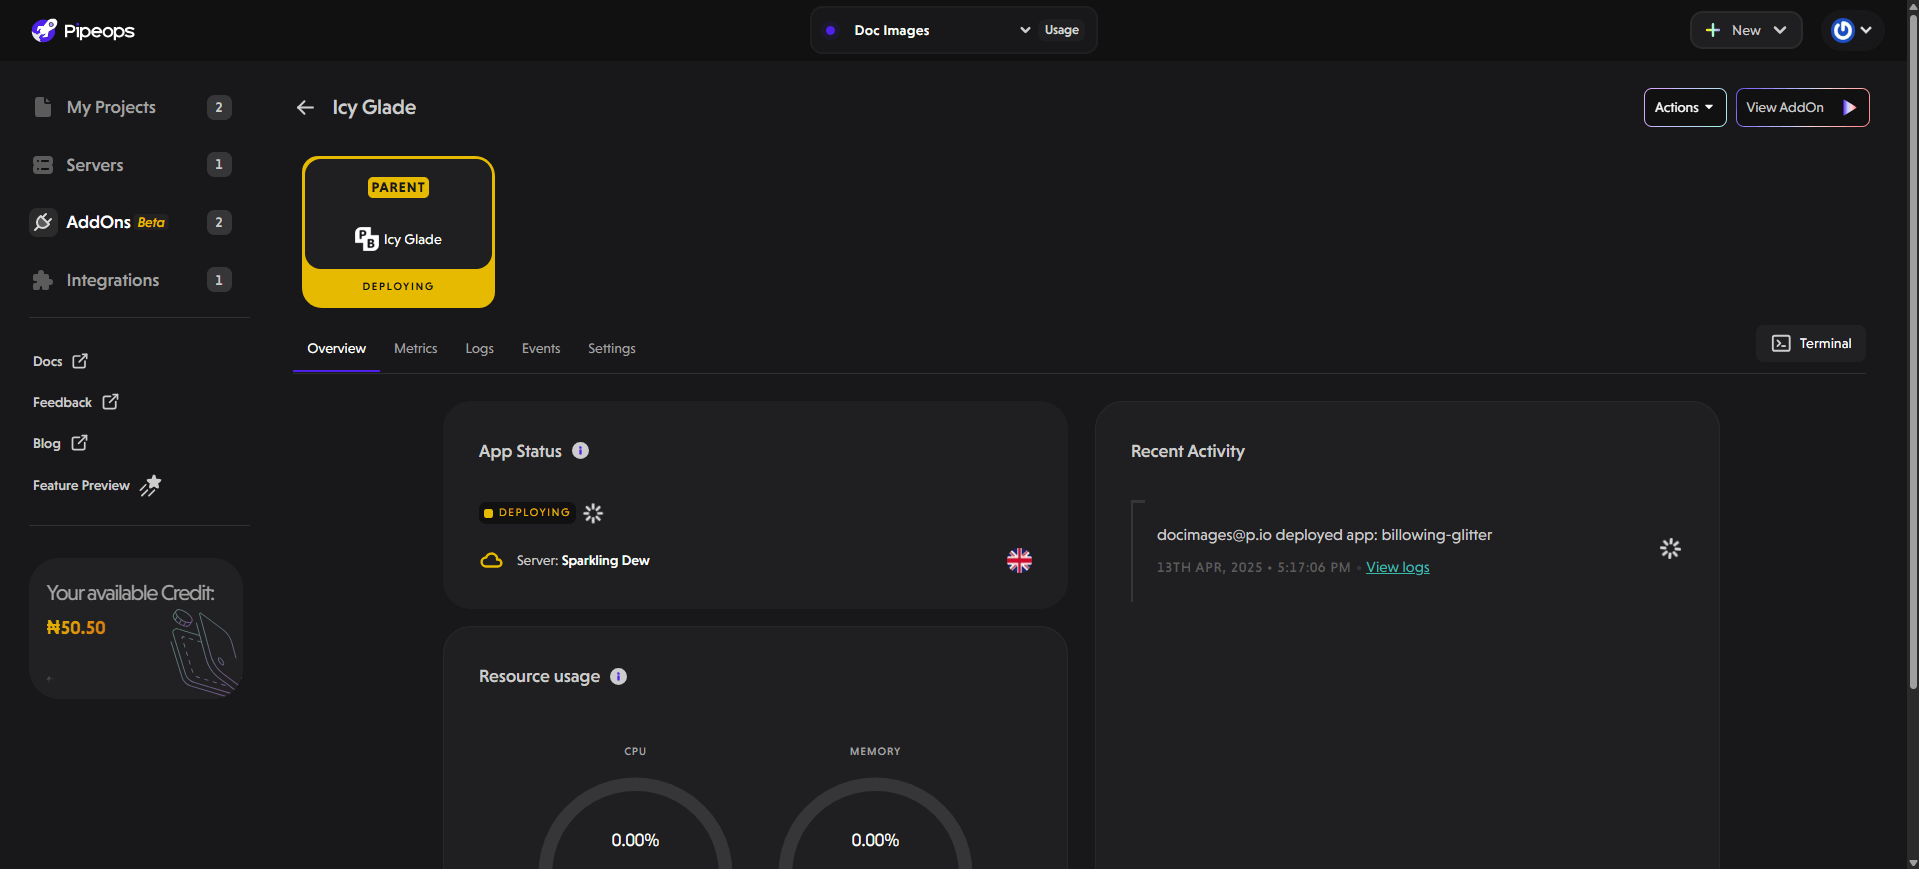
For non-database add-ons, you will find the following key sections on the overview page:
-
App Status: This section displays the current state of your application. You can check whether it's live, failed, or paused. It also provides details about the server name and region where your application is deployed, ensuring visibility into its infrastructure.
-
Resource Usage: Understanding resource usage is crucial for maintaining optimal performance. PipeOps offers intuitive charts detailing memory and CPU usage. For detailed resource metrics, click "Full resource metrics" to explore advanced insights.
-
Recent Activity: This section allows you to track changes made to your application. Stay informed about recent deployments, updates, or failures.
In addition to these features, you also have access to a tab navigation menu, which includes:
-
Metrics Tab: This section provides additional tab navigation, which provides details on Overview, CPU, Memory, Storage, Network I/O, and Control Plane for your add-on.
-
Logs Tab: Access and monitor your add-on's logs in real time.
-
Events Tab: Track important events and changes related to your add-on. This includes deployment events, configuration changes, scaling events, and system notifications. The events tab provides a chronological timeline of all significant activities, making it easier to understand the history and current state of your add-on.
-
Settings Tab: Manage and configure your add-on settings. This includes options to modify environment variables, update resource allocations, configure access controls, and manage domain settings. The settings tab provides a user-friendly interface for customizing your add-on's behavior and performance parameters.
Database Add-on Overview Page

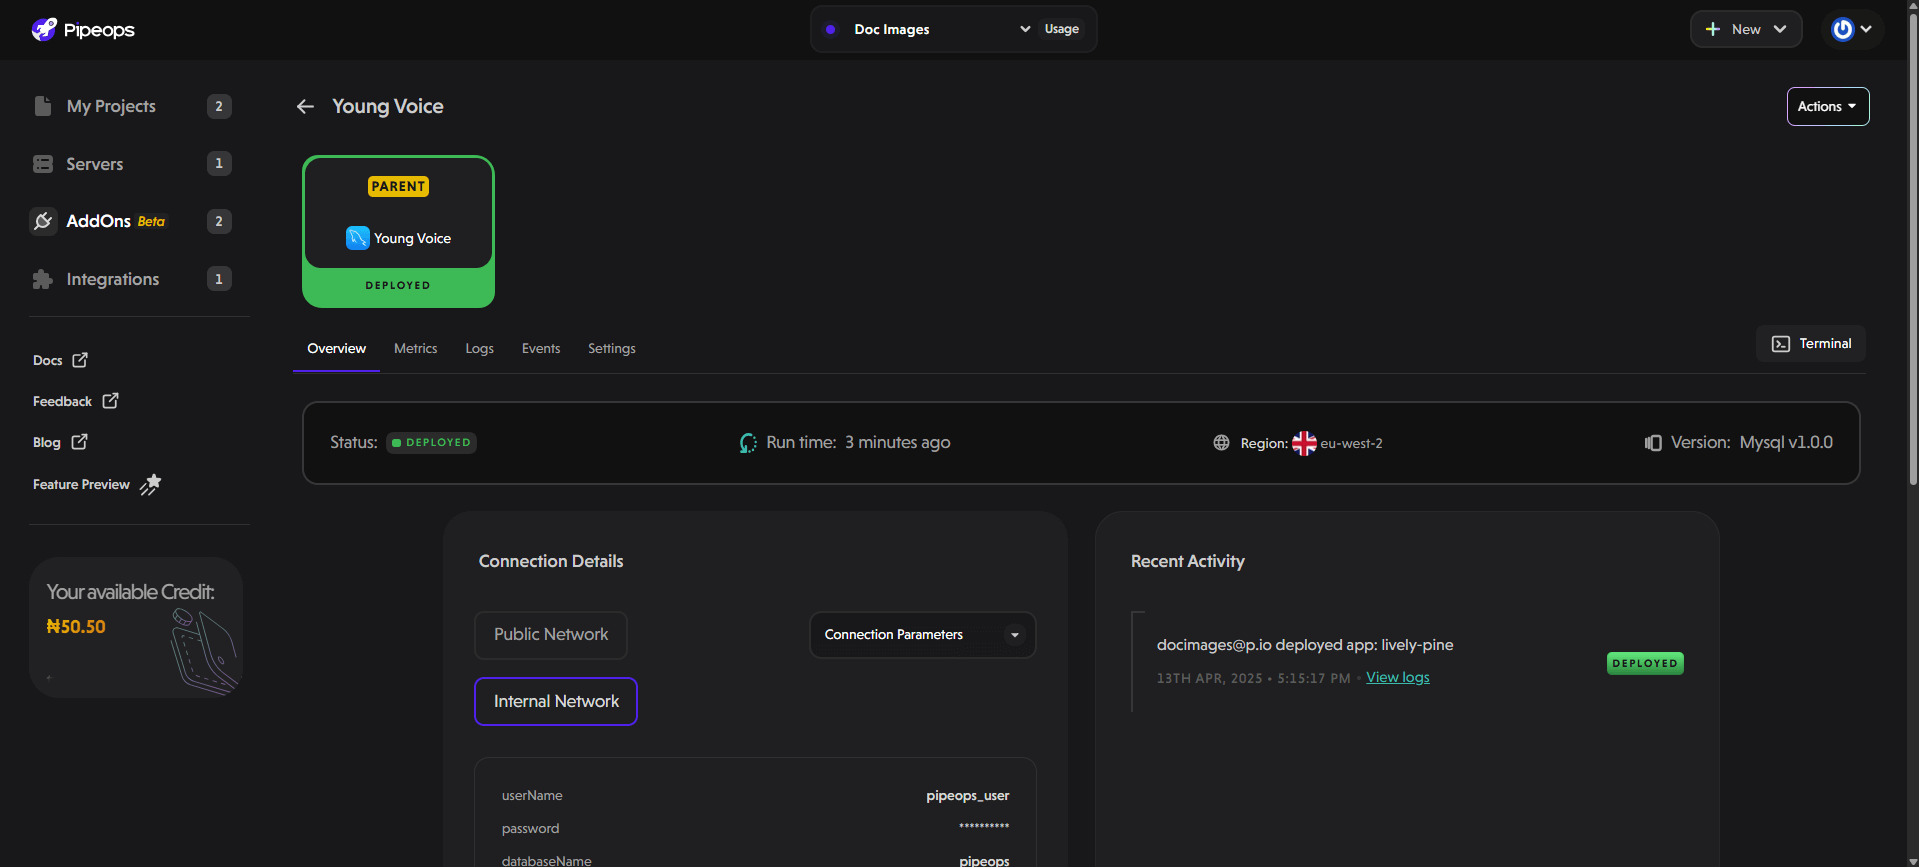
For database add-ons, the overview page contains these key sections:
- Status & Uptime: Indicates whether the database is running and how long it has been active.
- Database Version: Shows the current version of the database engine in use.
- Database Connection Details: Displays connection parameters such as username, password, database name, port, and internal hostname. These credentials are critical for establishing secure database connections.
- Resource Usage: Similar to non-database add-ons, it provides CPU and memory usage insights.
- Recent Activity: Logs deployment history and operational changes.
The Add-on Overview serves as a central hub for monitoring your add-ons, offering clear insights into their performance and health. For further details, you can explore individual tabs such as Metrics, Logs, Events, and Settings.