Server Events
The Events tab shows a chronological record of significant activities and status changes on your server. Use it to track what has happened on the server, understand state changes, and investigate issues before diving into metrics or logs.
Accessing Server Events
From the Servers section, select a server and click the Events tab.
Filtering Events
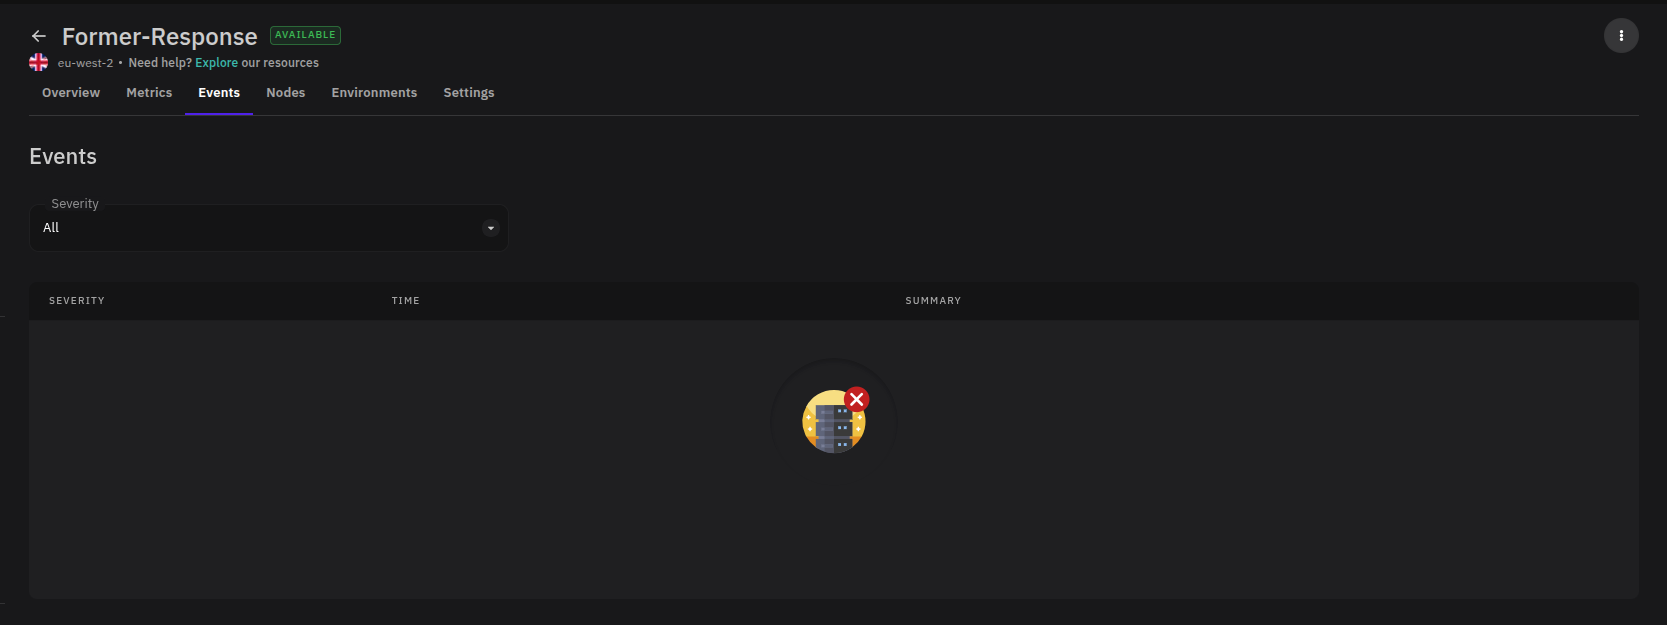
Use the Severity dropdown to filter the event list by level. This is useful when you want to focus on warnings or errors without scrolling through normal activity.
Event Columns
Each entry in the events table includes three columns:
| Column | Description |
|---|---|
| Severity | The level of the event — such as Normal or Warning — indicating how much attention it requires. |
| Time | The date and time the event occurred. |
| Summary | A short description of what happened, such as a pod being scheduled, a container failing to start, or a node becoming unavailable. |
Using Events for Troubleshooting
Events give you server-level context that sits between high-level status indicators and detailed logs. When a deployment behaves unexpectedly or a server changes state, check the Events tab first to identify what occurred and when before moving into metrics or application logs.
Look for Warning severity events as a starting point — these typically indicate resource pressure, scheduling failures, or connectivity issues that may affect running workloads.