Server Nodes
The Nodes tab gives you a view of the individual nodes that make up your server cluster, along with their current resource usage and status. Use it to check node health, understand resource distribution across the cluster, and identify nodes that may need attention.
Accessing Nodes
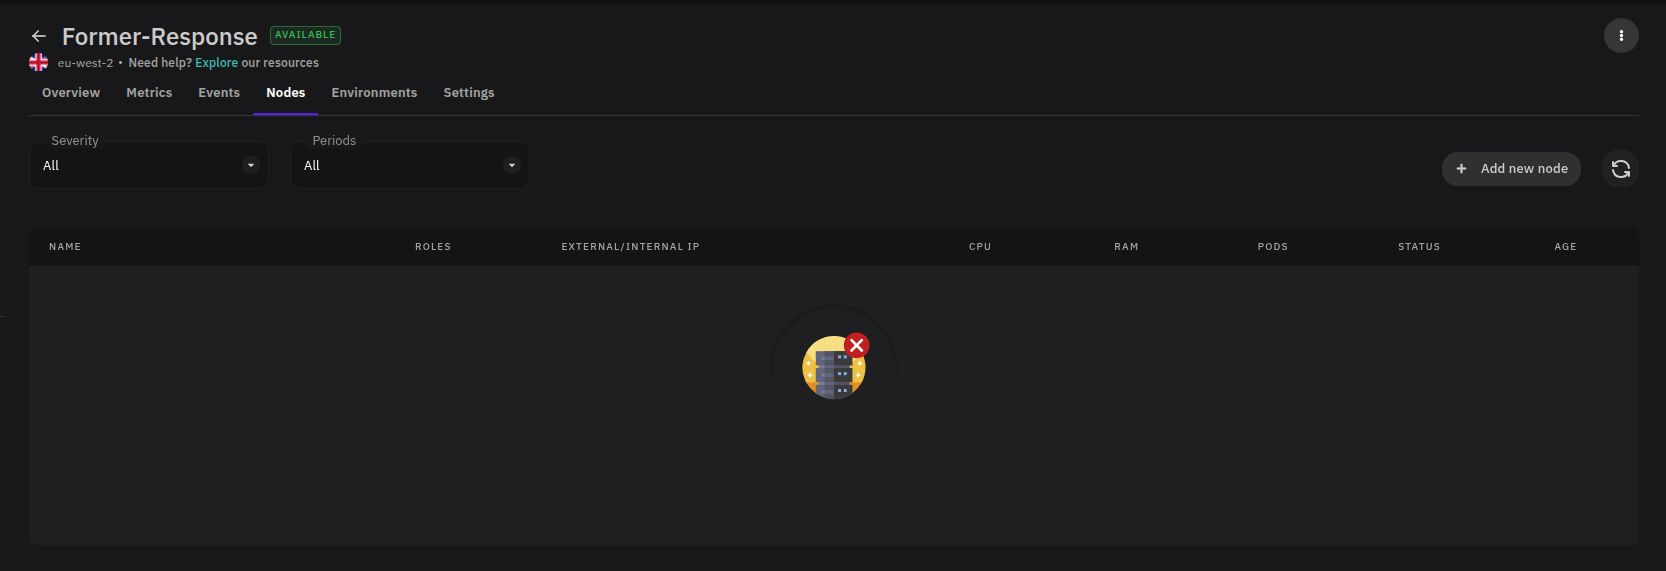
From the Servers section, select a server and click the Nodes tab.
Node Information
Each node in the list displays the following:
| Field | Description |
|---|---|
| Name | The name or identifier of the node within the cluster. |
| Roles | The function the node performs — such as worker or control plane. |
| External IP | The node's externally reachable IP address. |
| Internal IP | The node's internal cluster IP address. |
| CPU | Current CPU utilization for the node. |
| RAM | Current memory utilization for the node. |
| Pods | The number of pods currently running on the node. |
| Status | The node's current health state — Ready, NotReady, or Unknown. |
Using the Nodes Tab
Check the Status column first when investigating cluster issues. A node in NotReady or Unknown state may be causing pod scheduling failures or deployment instability. Cross-reference high CPU or RAM utilization with the Pods count to identify nodes that are overloaded relative to others in the cluster.
For a broader view of server performance, use the Metrics tab alongside the Nodes tab.