Server Metrics
The Metrics tab gives you a real-time and historical view of your server's performance. Use it to monitor resource consumption, identify bottlenecks, and understand how your server behaves over time.
Accessing Server Metrics
From the Servers section, select a server and click the Metrics tab.
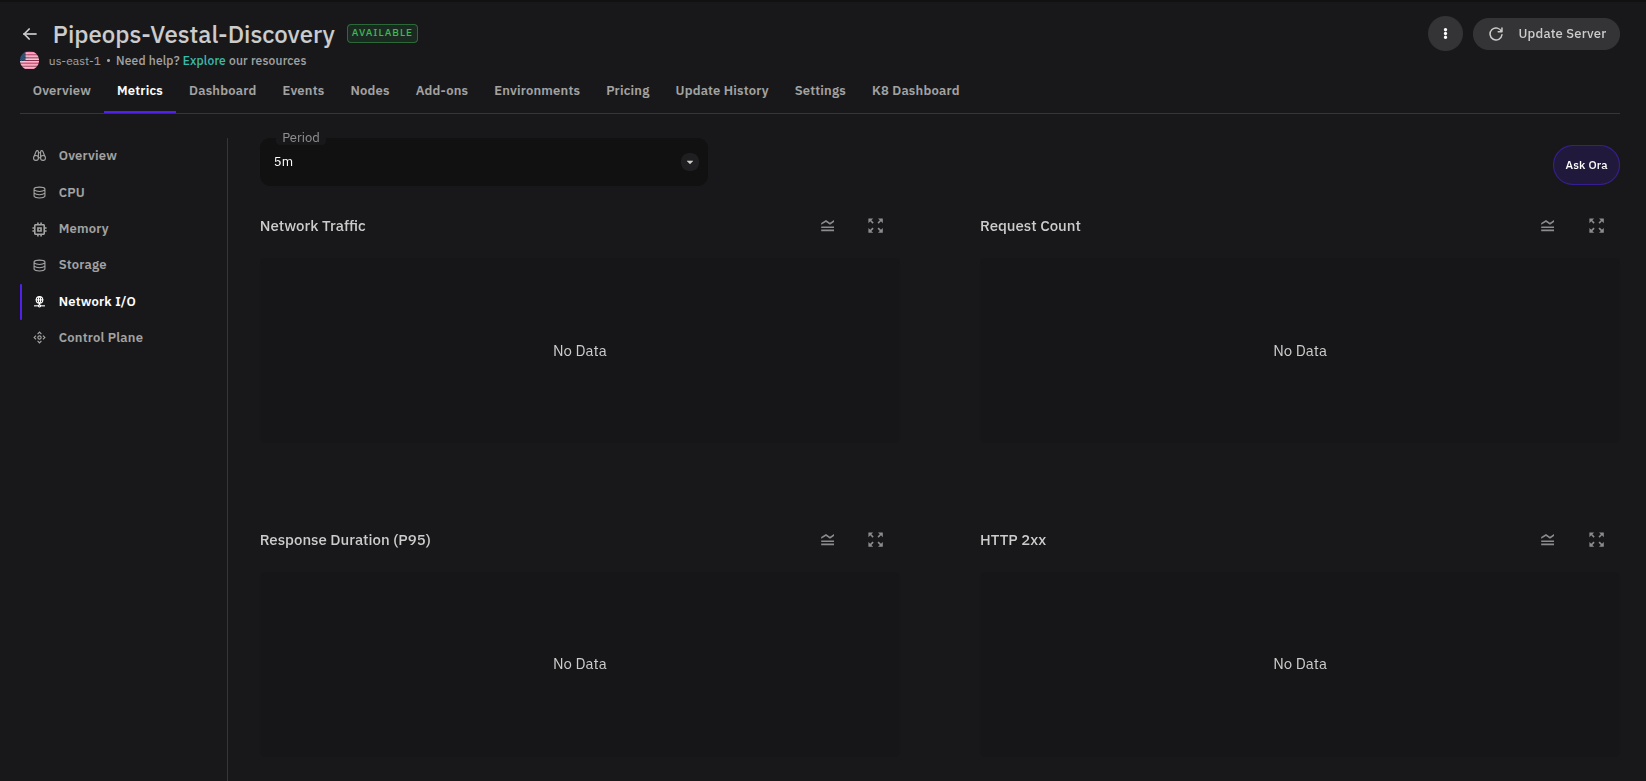
The metrics page has a left sidebar for navigating between metric categories and a Period dropdown for adjusting the time range shown across all charts.
Filtering by Time Period
Use the Period dropdown to filter metrics by a relative time
window. Available options include 5m, 15m, 1h, and longer
ranges. When you change the period, all charts in the active metric
section update together.
Metric Categories
Use the left sidebar to move between the following sections, each covering a different aspect of server health:
- Overview — A summary of key metrics across all categories.
- CPU — Processing capacity and throttling.
- Memory — Memory usage and capacity.
- Storage — Disk usage and total available size.
- Network I/O — Traffic, requests, errors, latency, and connections.
- Control Plane — Health of the server's control plane components.
Each chart includes controls for switching the graph view and expanding it for a closer look at trends.
Overview
The Overview section gives you a consolidated summary of the most important metrics across CPU, memory, storage, and network — all in one place. Use it for a quick server health check before diving into a specific category.
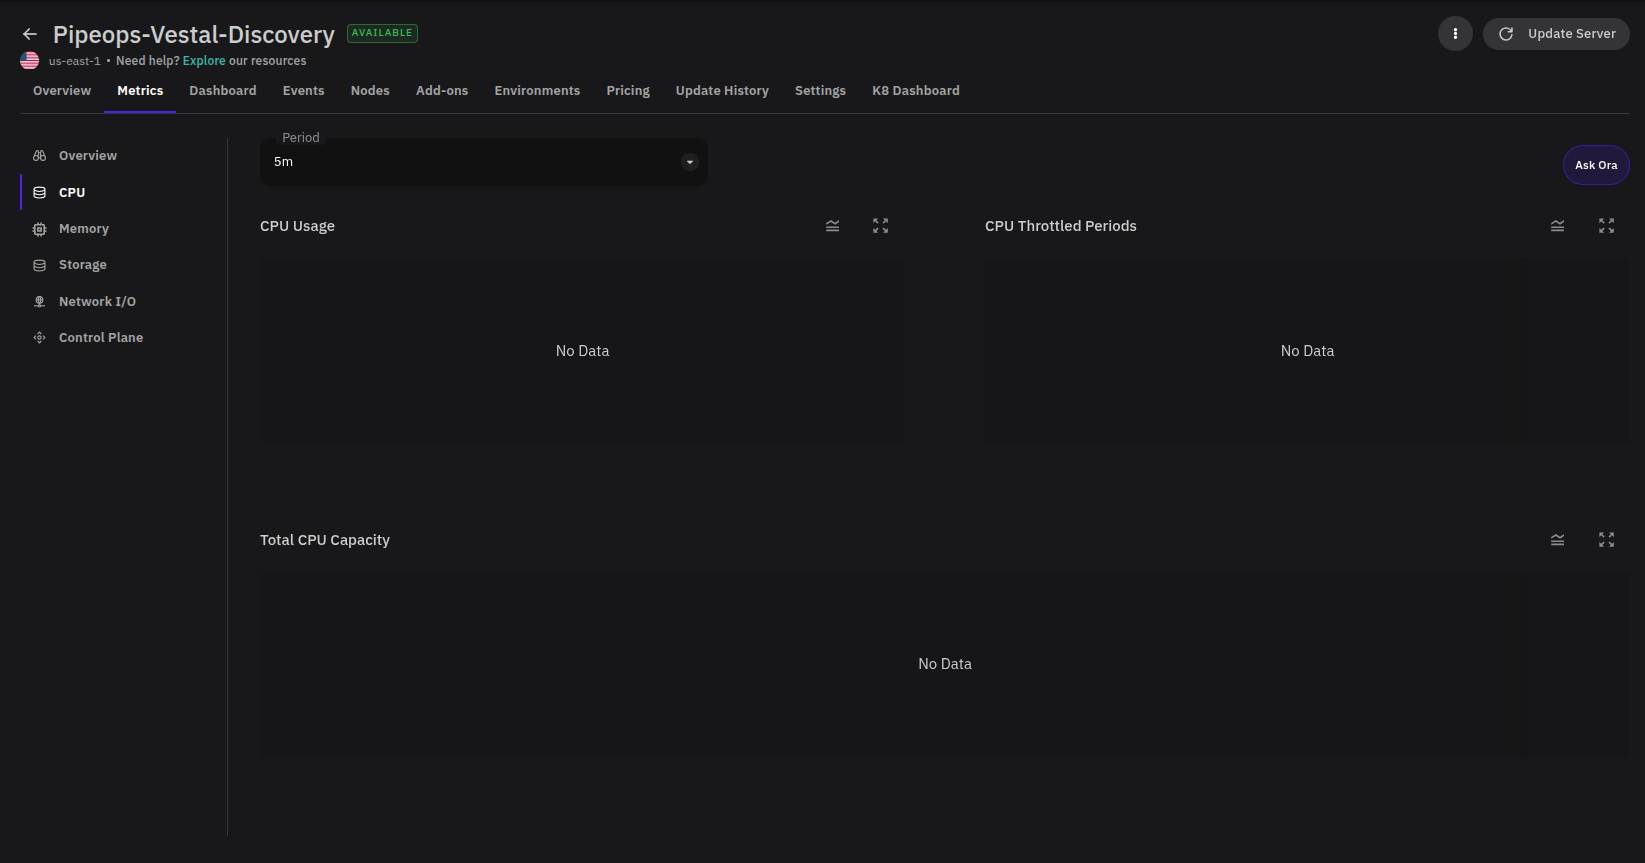
CPU
The CPU section shows how much processing capacity your server is using and whether workloads are being constrained by CPU limits.
| Chart | What it shows | How to use it |
|---|---|---|
| CPU Usage | CPU consumption over the selected period. | Look for spikes or sustained high usage that may indicate compute-heavy workloads or a need to scale up. |
| CPU Throttled Periods | Periods where workloads were restricted for exceeding CPU limits. | Identify workloads consuming more CPU than their configured limits allow — a signal to adjust limits or optimize the workload. |
| Total CPU Capacity | Total CPU available to the server over time. | Compare against usage to understand available headroom and plan capacity changes. |
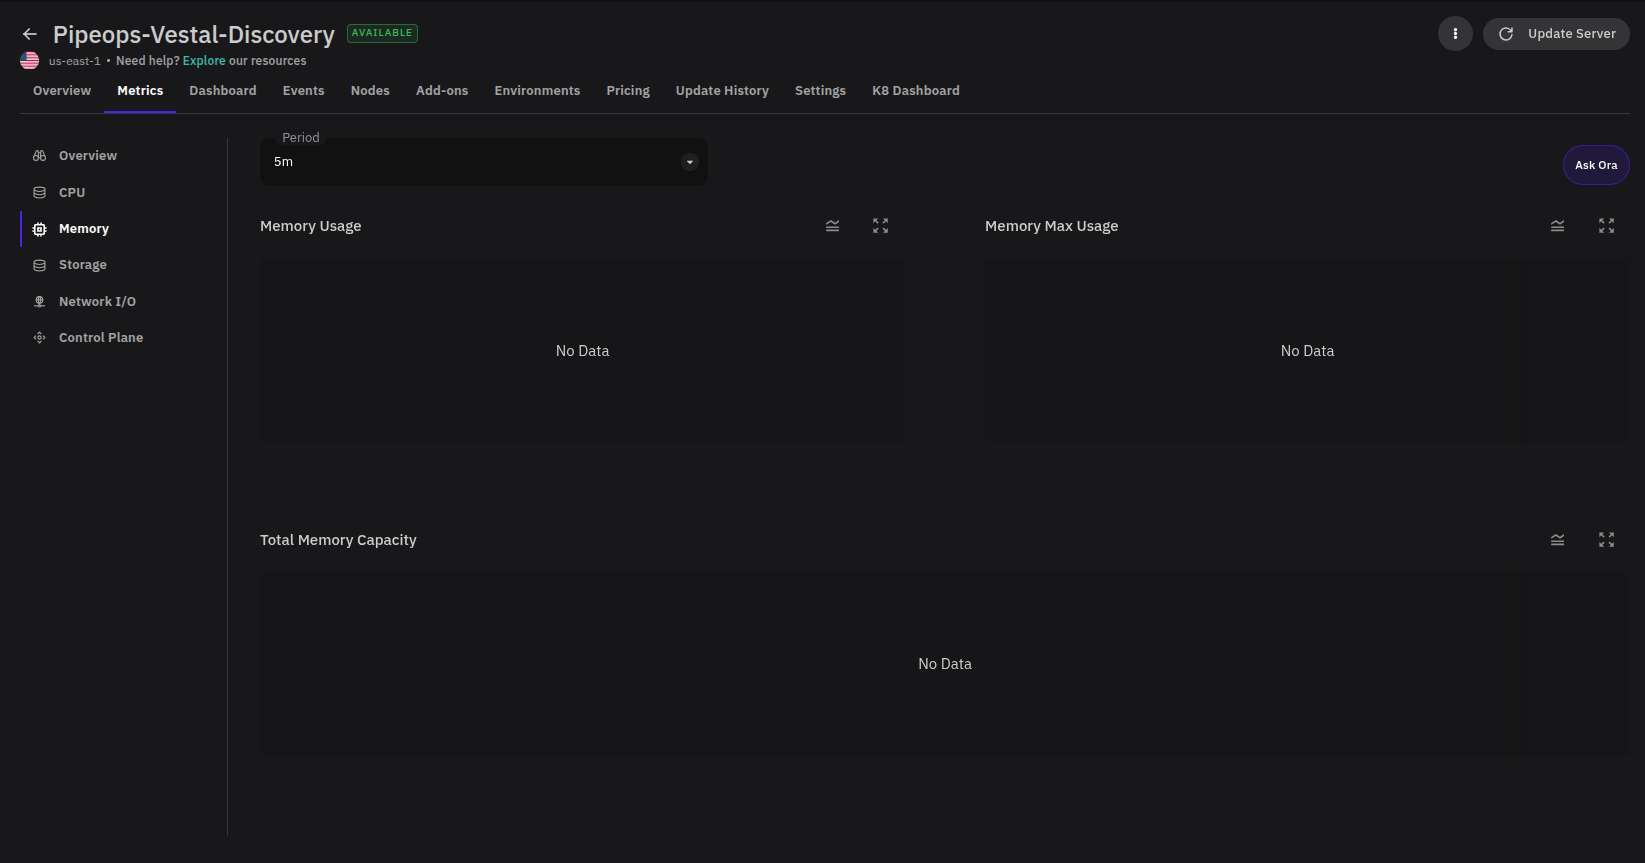
Memory
The Memory section shows how server memory is being consumed and whether usage is approaching available capacity.
| Chart | What it shows | How to use it |
|---|---|---|
| Memory Usage | Current memory consumption over the selected period. | Watch for steady increases or repeated peaks — these may require workload optimization or additional memory. |
| Memory Max Usage | The highest recorded memory usage during the selected period. | Understand peak demand, especially during traffic spikes or scheduled jobs, to size memory appropriately. |
| Total Memory Capacity | Total memory available to the server over time. | Cross-reference with usage and max usage to catch memory pressure before it affects stability. |
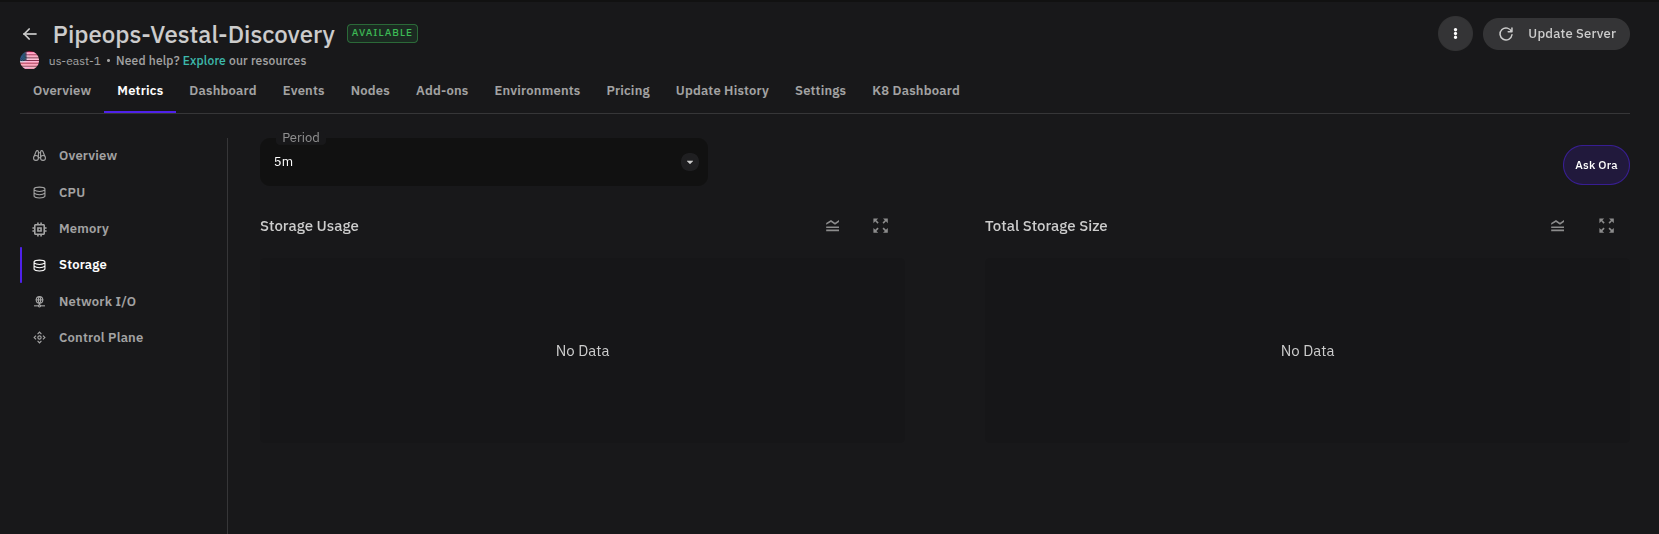
Storage
The Storage section helps you track disk usage and understand how much total storage your server has available.
| Chart | What it shows | How to use it |
|---|---|---|
| Storage Usage | Disk space consumed over the selected period. | Track growth trends and investigate sudden increases that could indicate log accumulation or data growth. |
| Total Storage Size | Total storage capacity available to the server. | Compare against usage to plan capacity increases before storage becomes constrained. |
Network I/O
The Network I/O section covers traffic volume, request handling, response times, error rates, and connection activity. Use it to understand how traffic moves through the server and how reliably the server responds.
Traffic and Requests
| Chart | What it shows | How to use it |
|---|---|---|
| Network Traffic | Inbound and outbound traffic over the selected period. | Identify traffic spikes, drops, or unusual transfer patterns that may need investigation. |
| Request Count | Total requests handled by the server. | Use alongside response time and error charts to understand whether volume changes correlate with performance degradation. |
| Response Duration (P95) | The 95th percentile response duration. | Captures high-end latency without being skewed by averages — a better indicator of what slower users experience. |
| HTTP 2xx | Successful HTTP responses. | Confirm that healthy response volume is tracking with request count. A drop here without a drop in requests may indicate errors. |
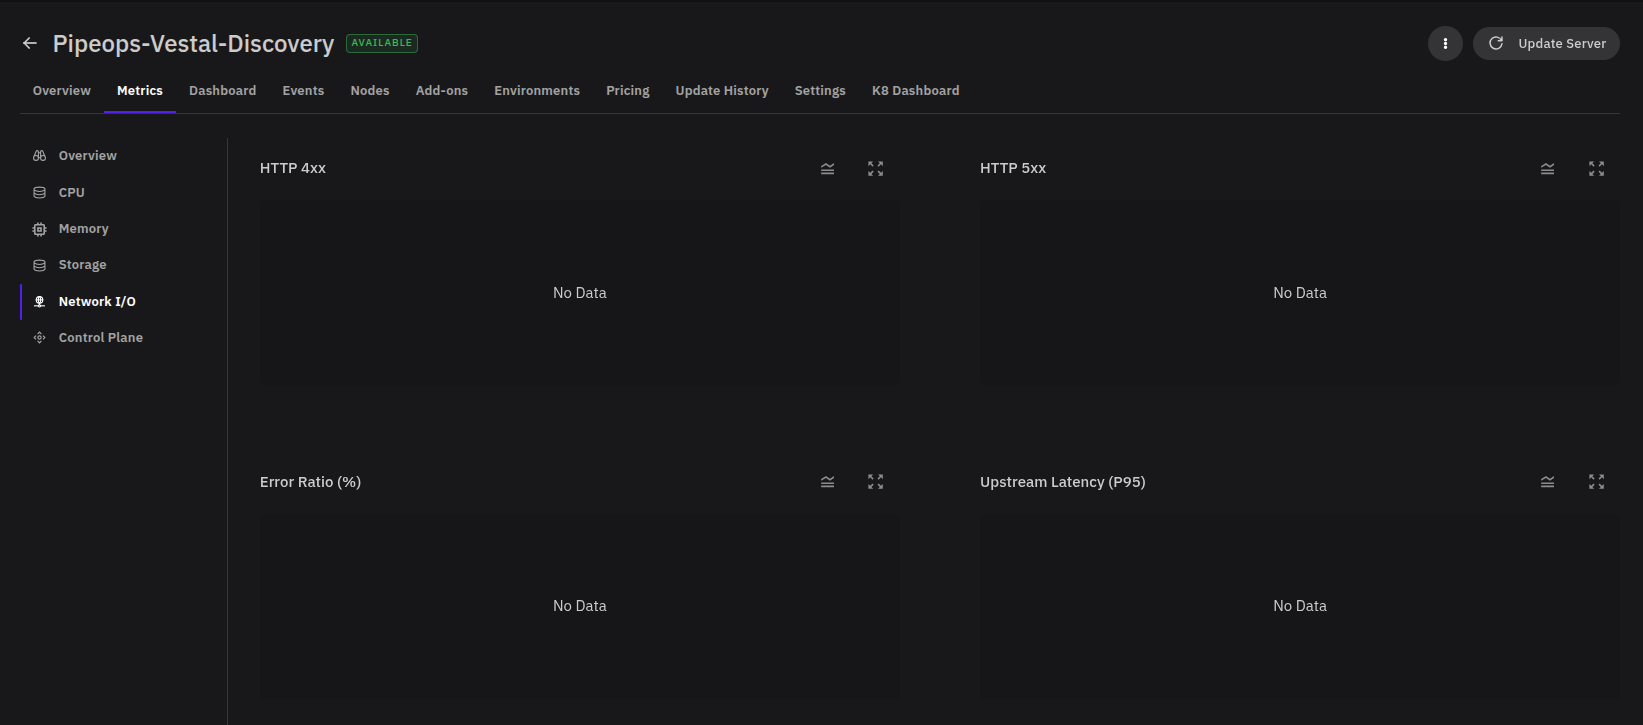
Errors and Latency
| Chart | What it shows | How to use it |
|---|---|---|
| HTTP 4xx | Client-side error responses. | Investigate unexpected increases — these may point to invalid requests, missing routes, or authentication failures. |
| HTTP 5xx | Server-side error responses. | Treat spikes as a signal to inspect application logs, upstream services, or infrastructure health. |
| Error Ratio (%) | Percentage of requests ending in errors. | Quickly assess whether error volume is isolated or affecting a meaningful share of traffic. |
| Upstream Latency (P95) | The 95th percentile latency from upstream services. | Identify whether slow responses originate from the server itself or from dependencies behind it. |
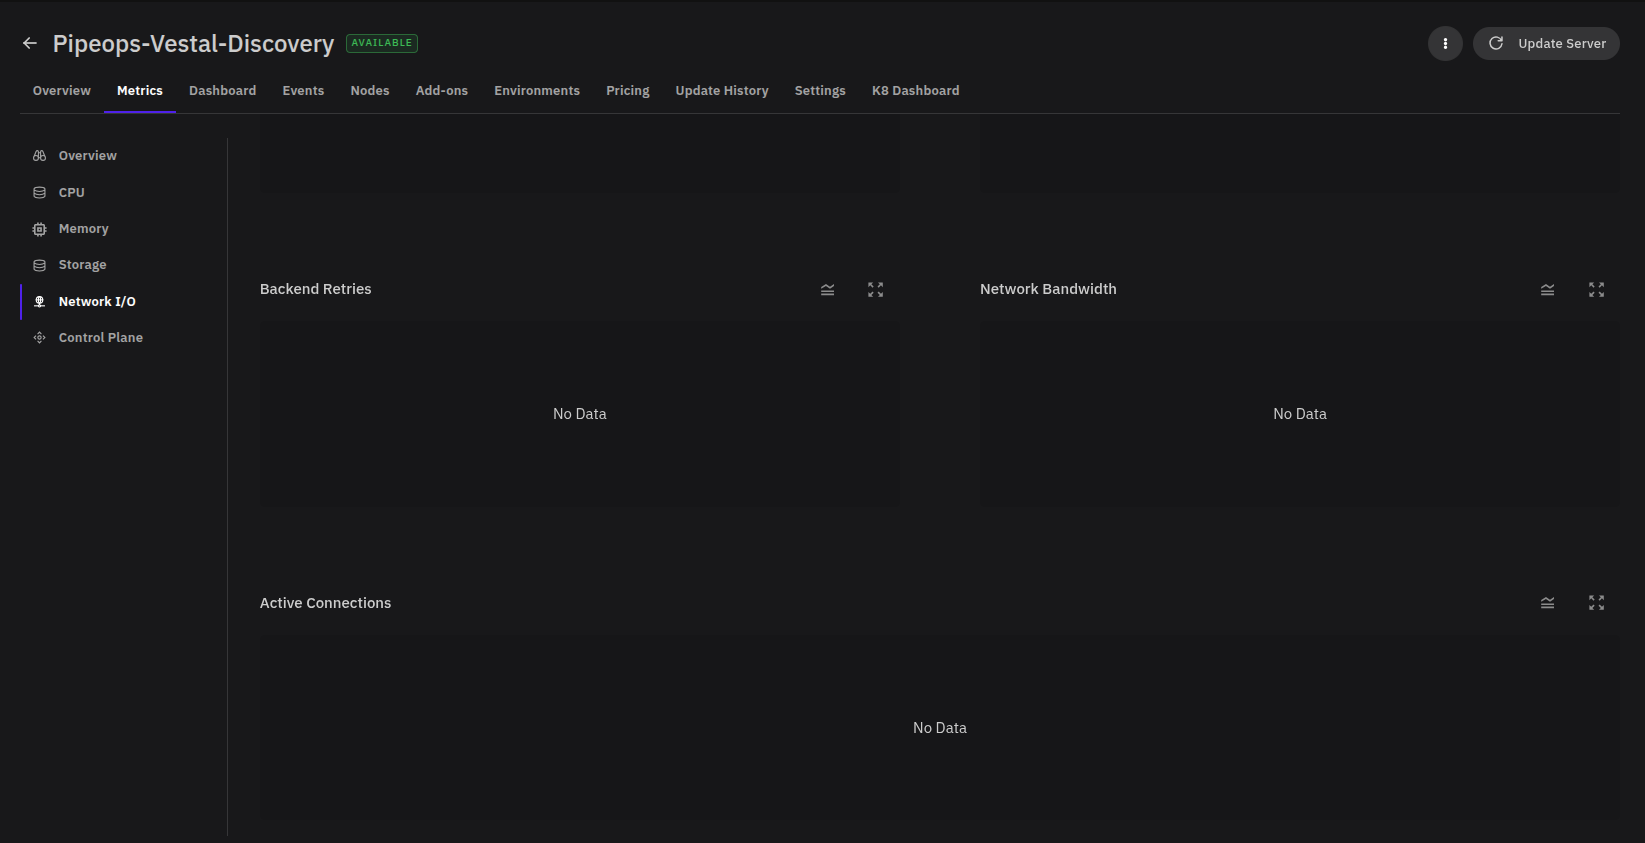
Bandwidth and Connections
| Chart | What it shows | How to use it |
|---|---|---|
| Backend Retries | Requests retried against backend services. | Rising retries may indicate unstable upstreams or transient network failures worth investigating. |
| Network Bandwidth | Bandwidth consumed by network traffic. | Compare against request count and traffic volume to catch unexpected bandwidth growth. |
| Active Connections | Open connections over the selected period. | Monitor connection load and detect sudden growth that could strain server capacity. |
Control Plane
The Control Plane section shows the health and availability of the components responsible for coordinating and managing the server. Use it to monitor the stability of the server's orchestration layer.
Interpreting Metrics
Read related charts together rather than in isolation. A few patterns to watch for:
- High CPU usage with throttled periods — Workloads are likely hitting their CPU limits. Consider raising limits or optimizing the workloads involved.
- Rising HTTP 5xx with higher upstream latency — Slow or failing responses may originate from a dependency, not the server itself.
- Steady storage growth — Investigate log accumulation or unmanaged data growth before storage becomes constrained.
- Spikes in active connections with no matching traffic increase — May indicate connection leaks or clients not closing connections cleanly.
Use the Period dropdown to compare a short spike against a longer baseline before making scaling or configuration changes.