Server Overview
The Overview tab is the default page when you open a server in PipeOps. It gives you a quick summary of the server's status, infrastructure details, resource usage, active deployments, and recent events.
The exact layout and available sections vary depending on how the server was provisioned — On PipeOps, Bring Your Own Cloud, or Bring Your Own Server — but the core questions it answers are the same: where is this server running, what is deployed on it, how much capacity is in use, and are there any events that need attention?
Accessing the Overview
From the Servers section, select a server. The Overview tab opens by default. If you are in another tab, click Overview in the server navigation to return to it.
Server Details Banner
At the top of every Overview tab, a details banner summarizes the server's infrastructure metadata.
| Field | Description |
|---|---|
| Created | How long ago the server was created or connected. |
| Region | The deployment region or gateway region associated with the server. |
| Provider | The infrastructure provider — such as PipeOps PKS, Amazon EKS, or another connected provider. |
| Kubernetes Version | The Kubernetes version running on the server. |
| Egress IP | The outbound IP address used by the server. Availability depends on the server type. |
Summary Cards
Below the details banner, three summary cards show the server's current scale and activity.
| Card | What it shows |
|---|---|
| Nodes | The number of nodes currently attached to the server. Click to open node-level details. |
| Deployments | The number of projects and add-ons deployed to this server. |
| Total Resources | The combined count of Kubernetes resources — such as pods, services, and config maps — currently tracked on the server. |
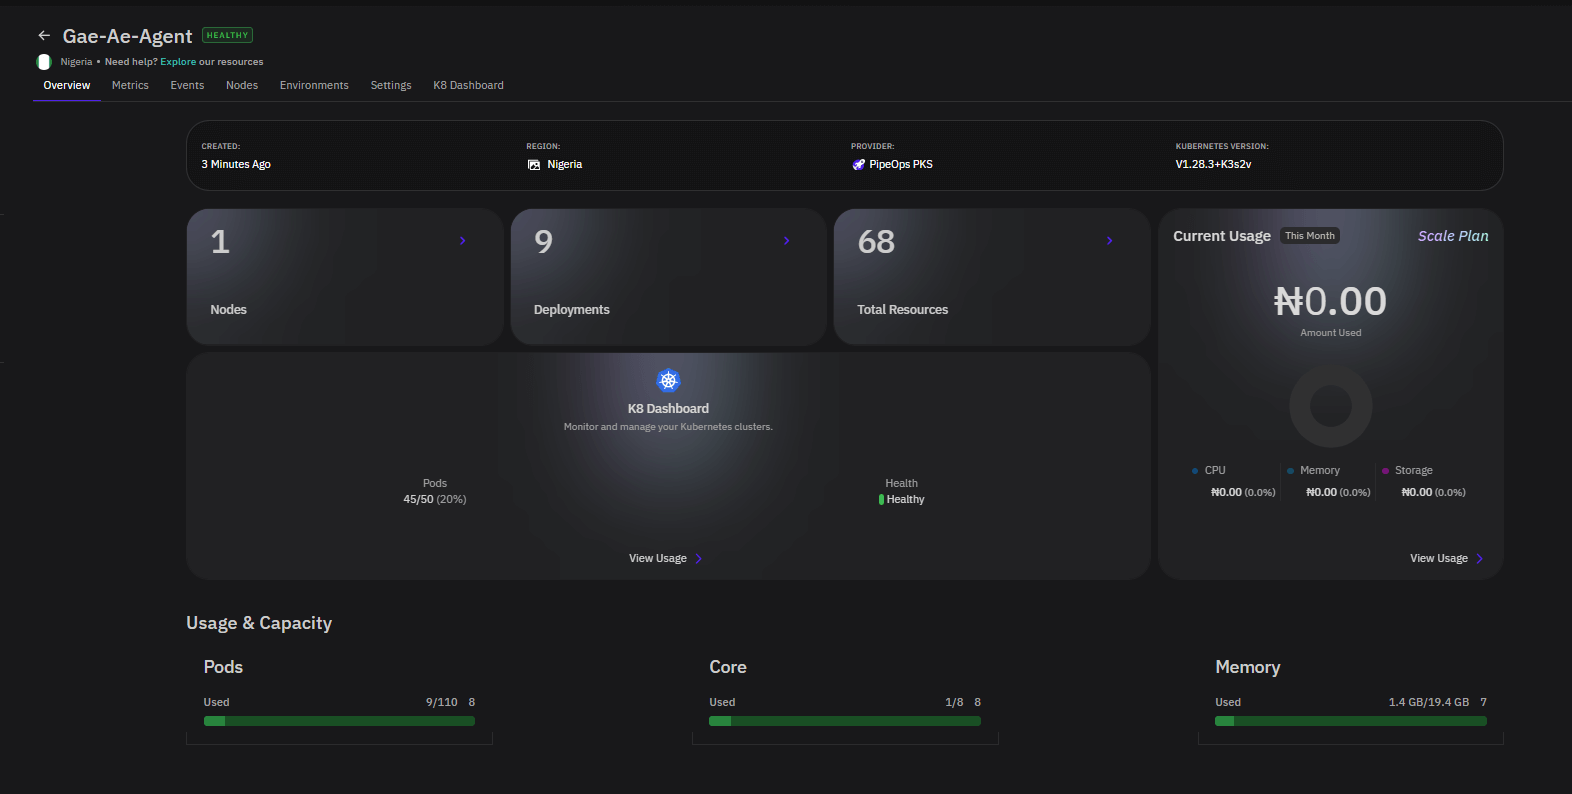
PipeOps Nova Server Overview
Nova servers are provisioned and managed by PipeOps. Their overview focuses on the resources PipeOps provisions and bills for on your behalf.
| Section | What it shows |
|---|---|
| Server Details | Created date, region, provider, Kubernetes version, and egress IP. |
| Nodes, Deployments, Total Resources | High-level counts for the server. |
| Current Usage | CPU, memory, and storage costs for the current month. |
| Usage & Capacity | Capacity indicators for pods, CPU cores, and memory. |
| K8 Dashboard | A shortcut for Kubernetes cluster monitoring, when available. |
| Events | Recent server events with severity, time, and summary. |
Bring Your Own Cloud Server Overview
BYOC servers run in a cloud account you connected to PipeOps. The overview reflects cloud-provider-specific infrastructure and may include additional sections depending on the provider and configuration method selected during provisioning.
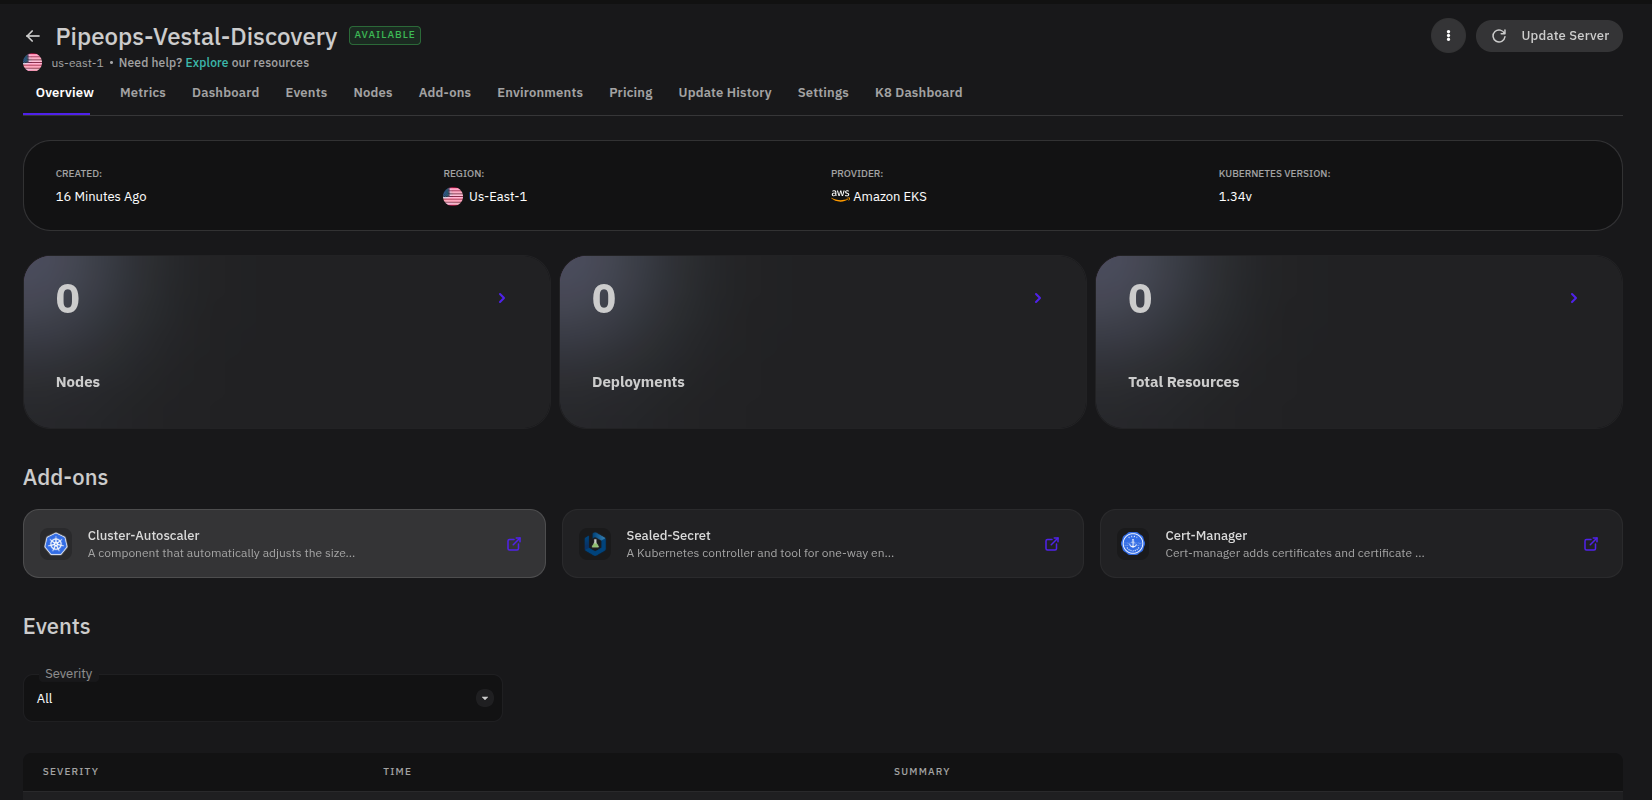
| Section | What it shows |
|---|---|
| Server Details | Created date, region, connected provider, and Kubernetes version. |
| Nodes, Deployments, Total Resources | A summary of the resources PipeOps tracks in the connected cluster. |
| Add-ons | Installed or available cluster add-ons such as autoscaling, certificate management, or secret management tools. |
| Events | Recent server events with severity, time, and summary. |
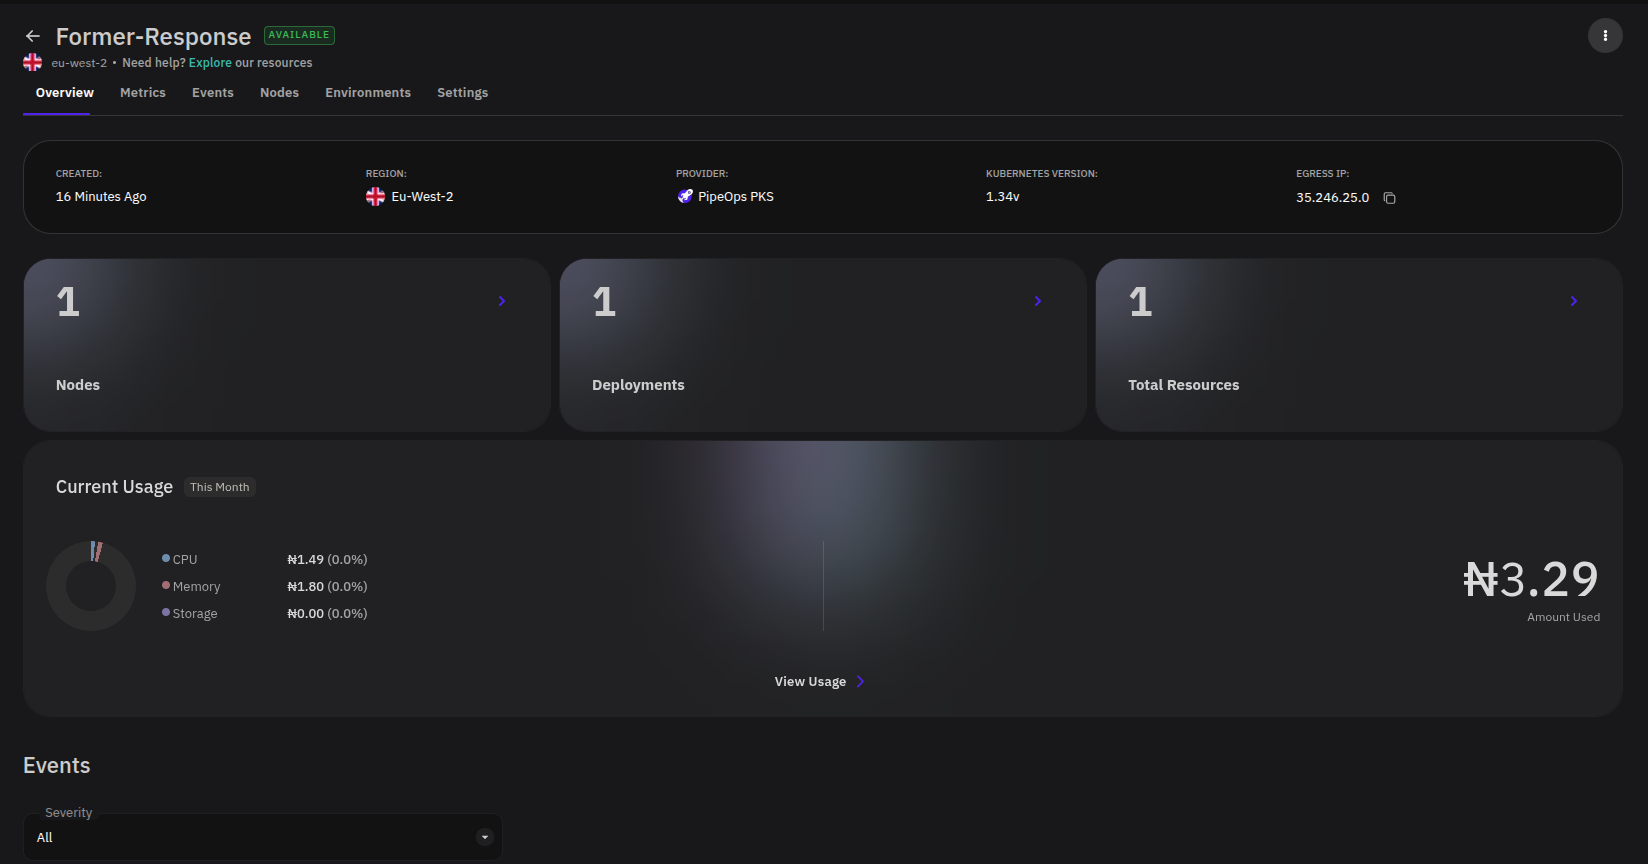
Bring Your Own Server Overview
BYOS servers are machines or VMs you connected to PipeOps. The overview reflects the connected machine's agent-reported state.
| Section | What it shows |
|---|---|
| Server Details | Created date, gateway region, provider, and Kubernetes version. |
| Nodes, Deployments, Total Resources | Summary counts for the connected server. |
| Current Usage | CPU, memory, storage, and bandwidth costs for the current month where applicable. |
| K8 Dashboard | A shortcut for Kubernetes-level visibility, when available. |
| Usage & Capacity | Capacity indicators for pods, CPU cores, and memory. |
| Events | Recent server events with severity, time, and summary. |
Server Navigation Tabs
The tabs available on a server vary by provisioning method and enabled features.
| Tab | Description |
|---|---|
| Overview | Server status, infrastructure details, resource usage, and events. |
| Metrics | CPU, memory, storage, network I/O, and control plane performance charts. |
| Events | A dedicated full-page view of server events. |
| Nodes | Node-level details, resource usage, and status. |
| Environments | Environments configured for deployments on this server. |
| Settings | Server configuration and management options. |
Depending on the server type, you may also see tabs such as Add-ons, Pricing, Update History, Dashboard, or K8 Dashboard.
Events
Every server type includes an Events section on the Overview tab. If it is not immediately visible, scroll down the page.
Use the Severity filter to narrow the event list by level. Each event row shows:
| Column | Description |
|---|---|
| Severity | The event level — normal, warning, or error. |
| Time | When the event occurred. |
| Summary | A short description of what happened. |
Check the Events section when a server changes state unexpectedly, a deployment behaves abnormally, or you want server-level context before moving into metrics, logs, or node details.