Logs And Events
The Logs and Events tabs give you visibility into your project's runtime behaviour and deployment activity. Use them together to troubleshoot issues, monitor performance, and trace the sequence of infrastructure events.
Logs
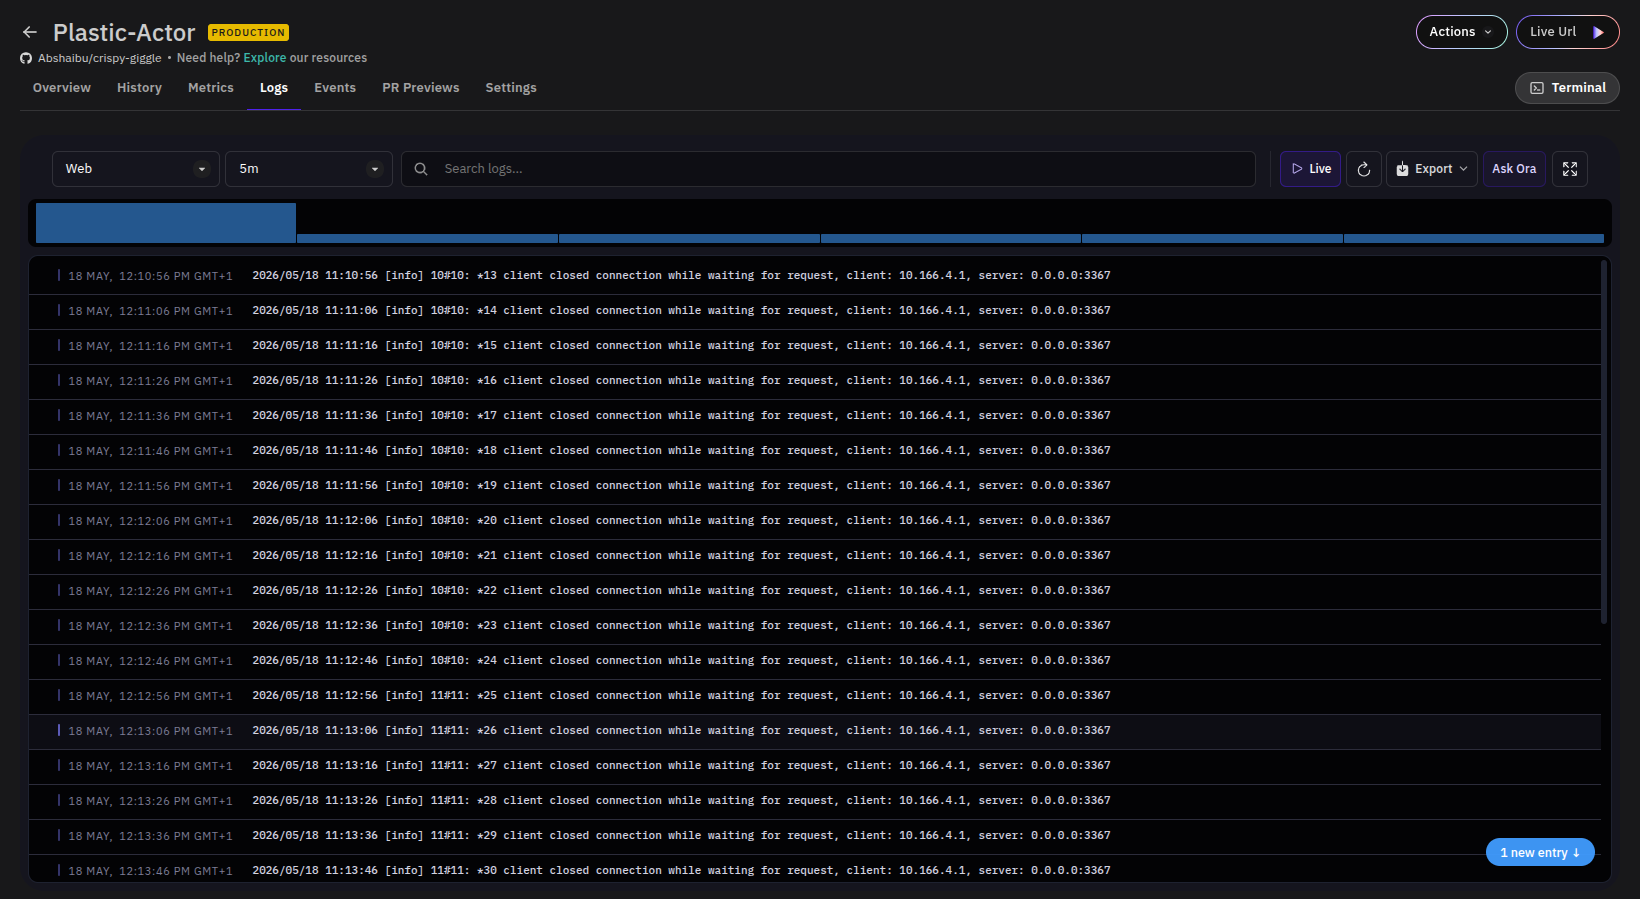
Navigate to your project and click the Logs tab to view a real-time stream of output from your project's container.
Filtering and Search
- Source — Select the log source (e.g.
Web) from the dropdown on the left. - Period — Filter logs by a relative time window such as
5mor1h. - Search — Use the search bar to find specific log entries by keyword.
Toolbar Actions
| Action | Description |
|---|---|
| Live | Streams new log entries in real time as they are generated. |
| Refresh | Manually reloads the log view. |
| Export | Downloads the current log output. |
| Ask Ora | Opens the Ora AI assistant for help interpreting logs. |
| Fullscreen | Expands the log view to fill the screen. |
Events
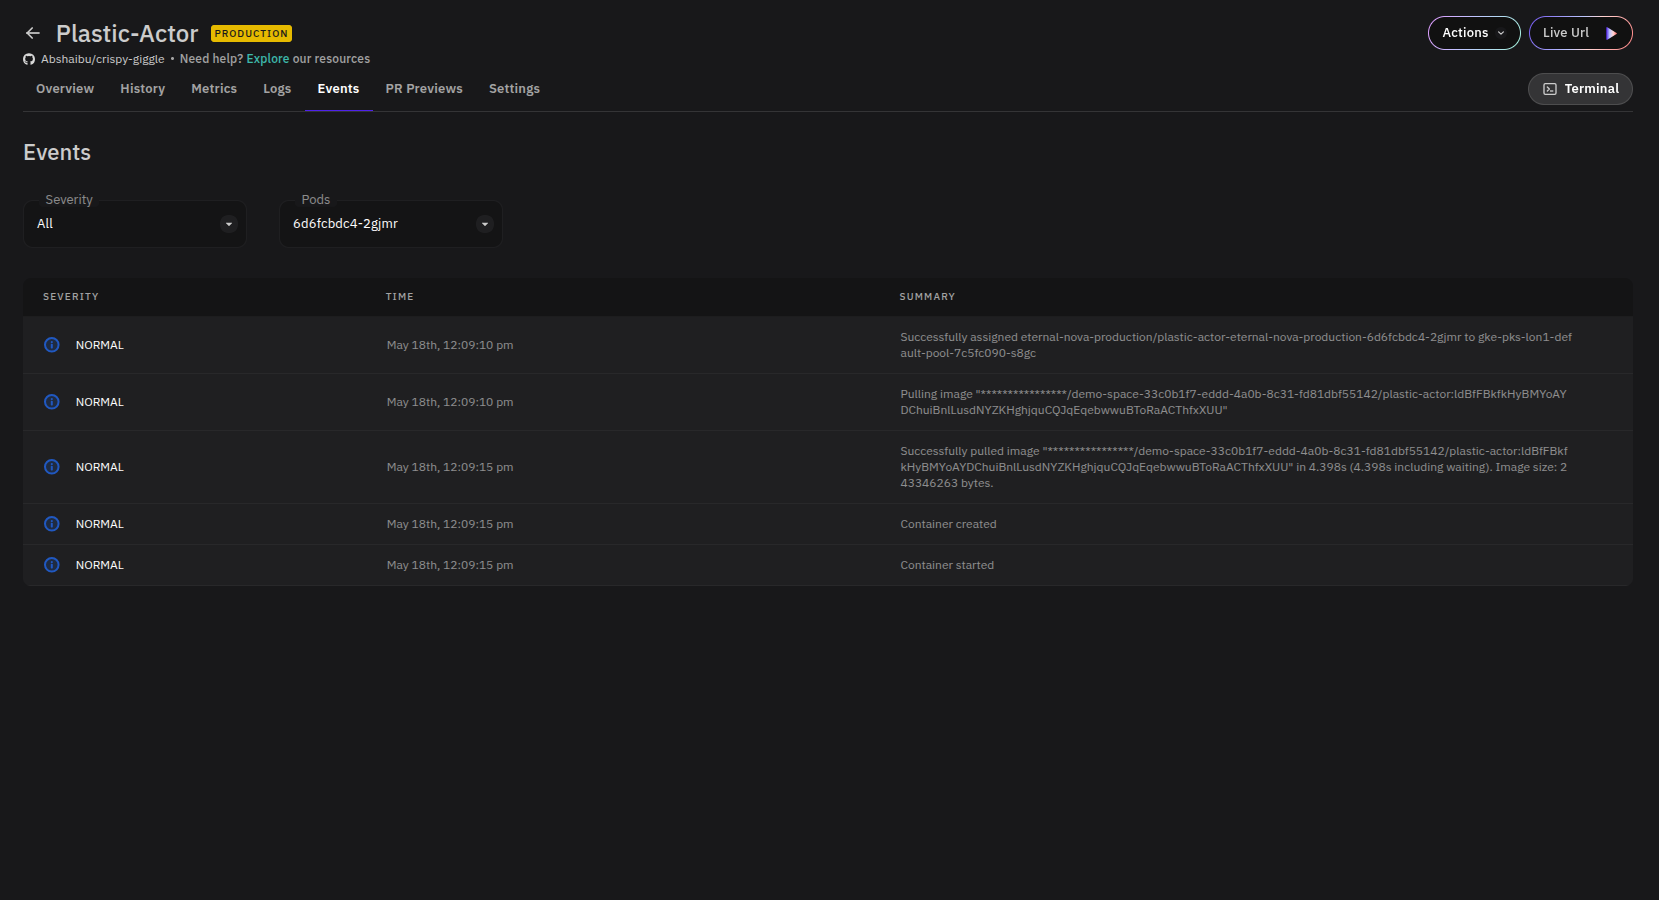
Navigate to your project and click the Events tab to view a timestamped record of infrastructure-level activity, such as pod scheduling, volume attachment, image pulls, and container lifecycle changes.
Filtering
- Severity — Filter events by severity level. Available options include
All,Normal, andWarning. Normal events reflect expected system activity; warnings indicate conditions that may need attention. - Pods — Scope the event list to a specific pod (e.g.
Production-0) when your project runs multiple replicas.
Reading Events
Each event entry shows three fields:
- Severity — The event classification (
NormalorWarning). - Time — When the event occurred.
- Summary — A short description of what happened, such as
Container startedorAttachVolume.Attach succeeded.
A typical healthy deployment produces a sequence of Normal events: pod assigned → volume attached → image pulled → container created → container started.