Project Metrics
The Metrics tab gives you a real-time and historical view of your project's performance across CPU, memory, storage, and network activity. Use these charts to spot usage trends, identify resource bottlenecks, and track how your project behaves over time.
Accessing Metrics
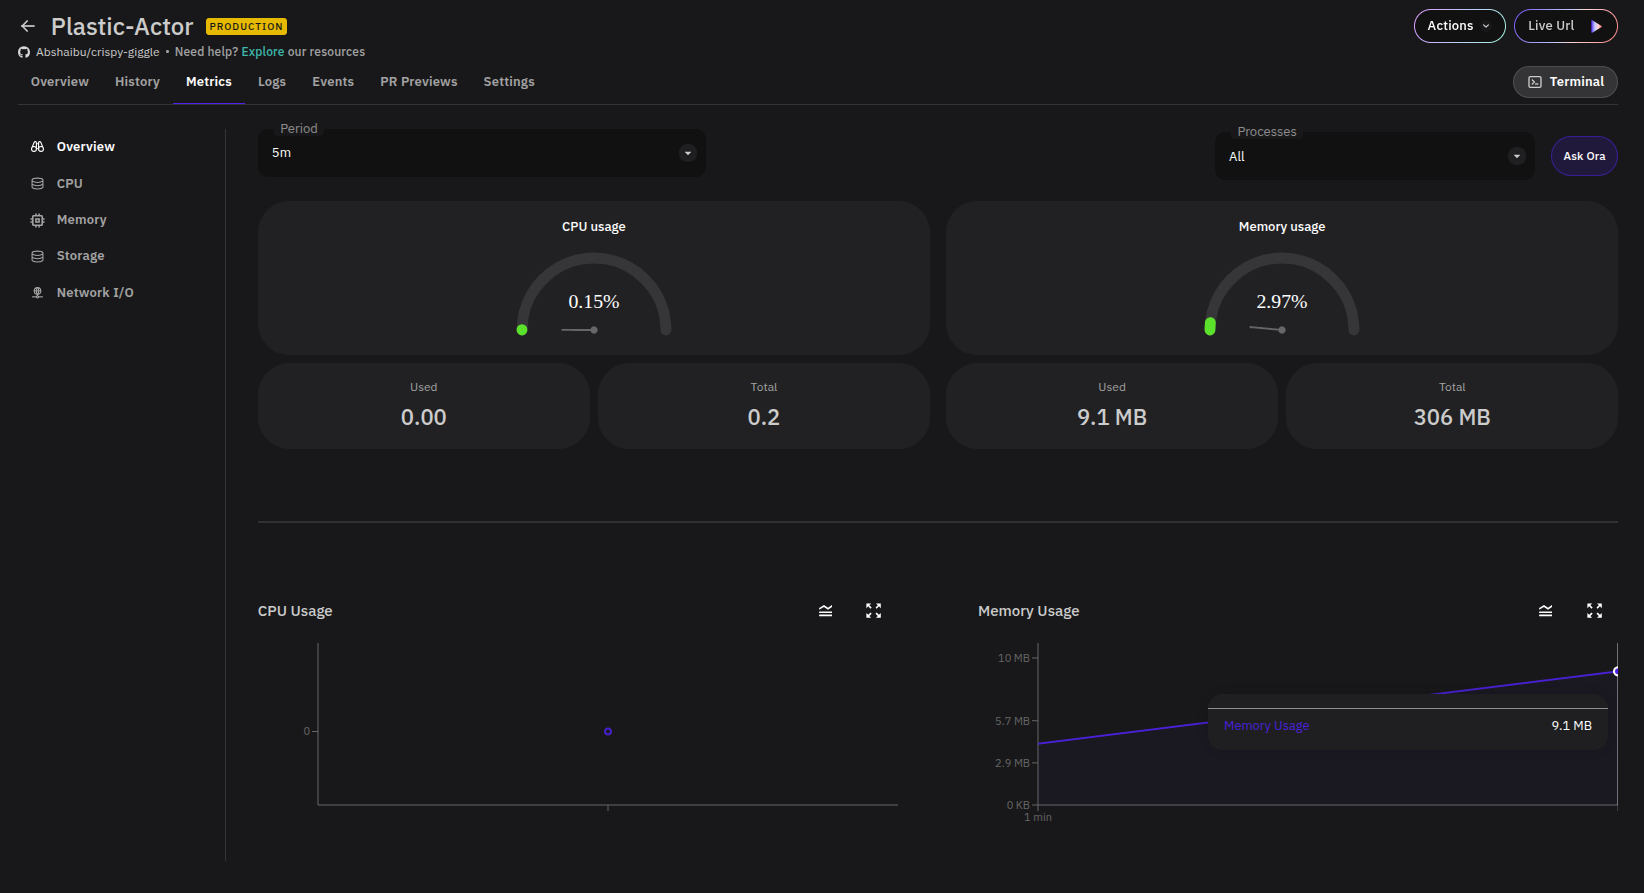
Navigate to your project and click the Metrics tab. The Overview section loads by default, showing a summary of all key metrics at a glance — including current CPU and memory usage gauges, used/total resource tiles, and time-series charts for storage and memory.
Filtering by Time Period
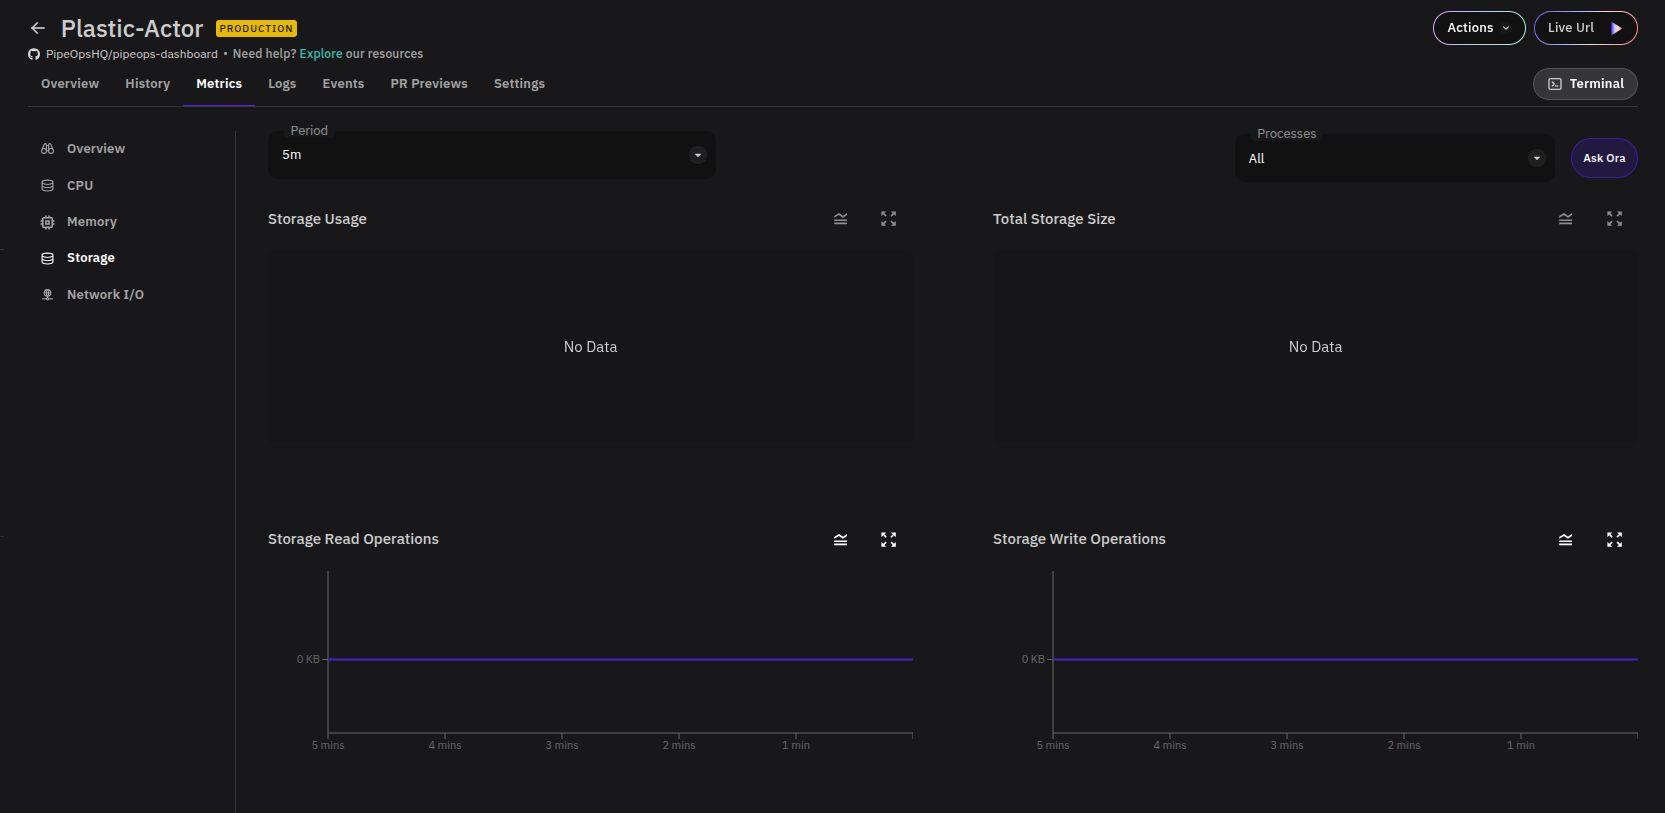
Use the Period dropdown at the top of the page to filter all charts by a relative time window (e.g. 5m, 15m, 1h). All charts update simultaneously when the period changes.
Metric Sections
Use the left sidebar to navigate between metric categories. Each section provides a dedicated time-series chart for that resource.
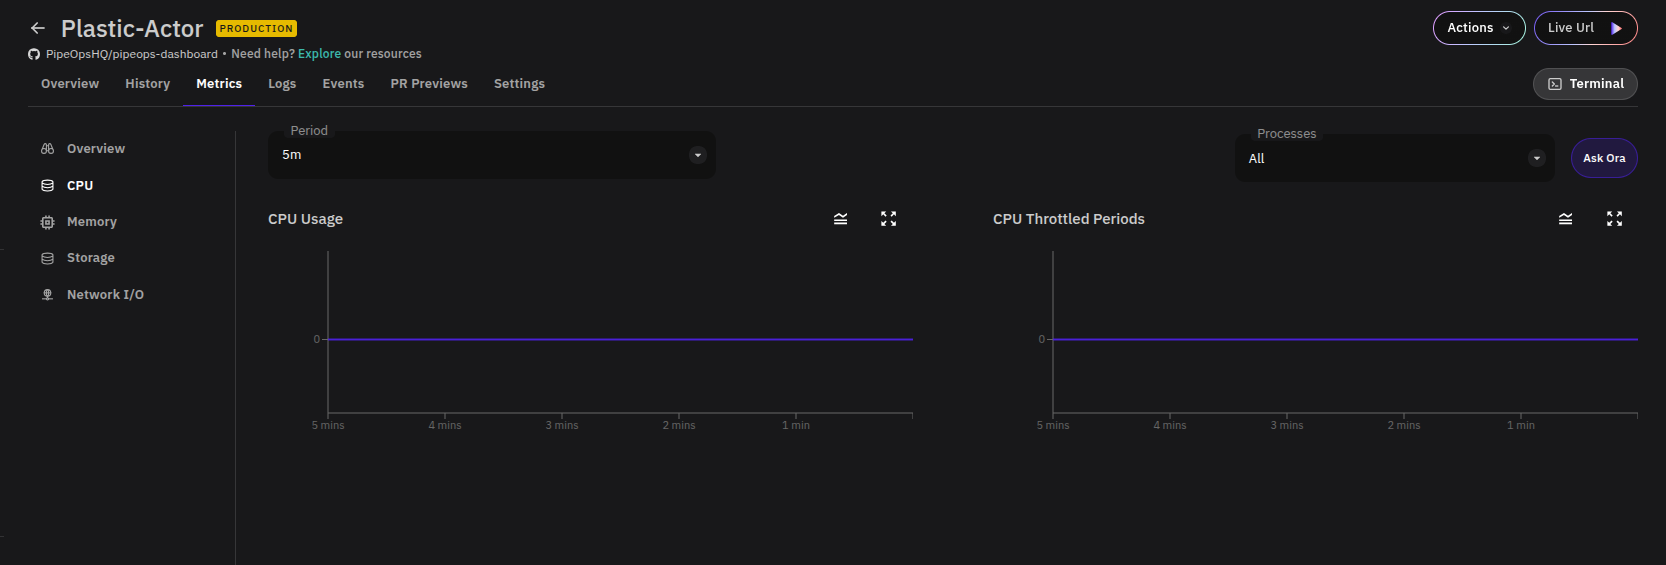
CPU
Shows the processing power consumed by your project over the selected period. Use this to identify compute spikes or sustained high load that may require scaling.
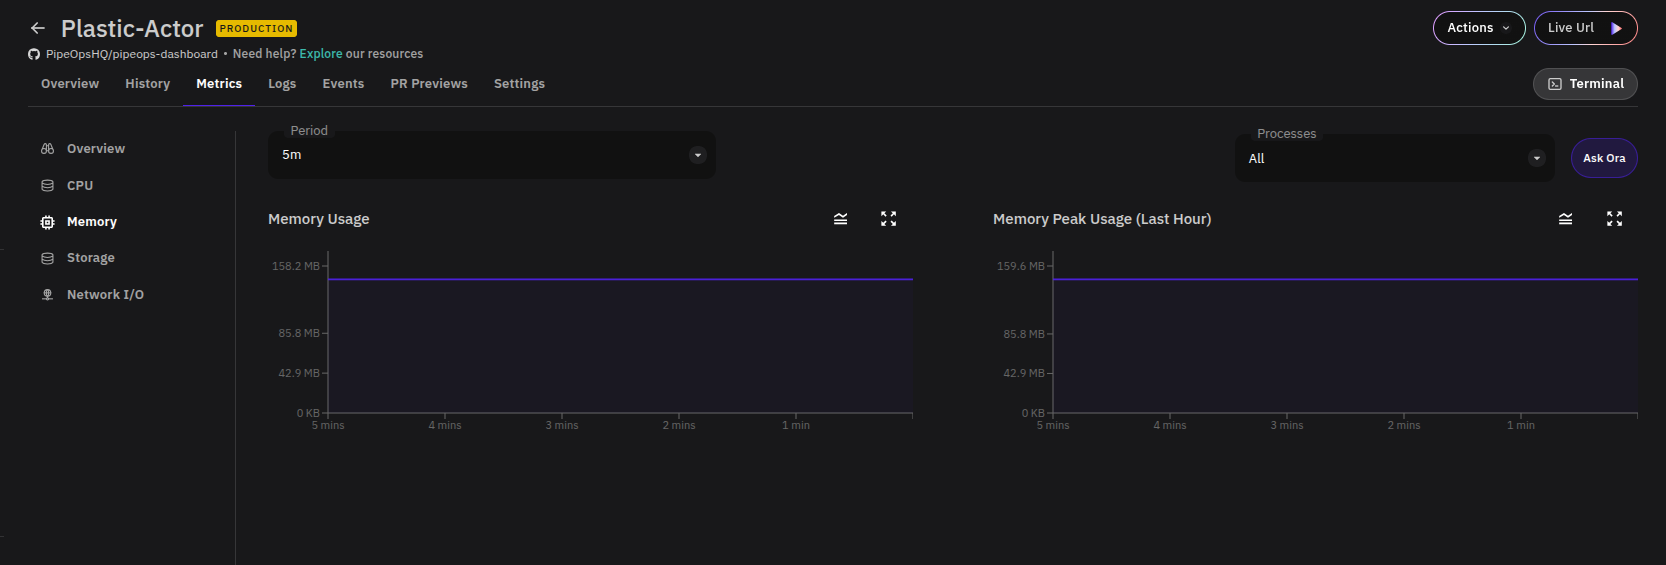
Memory
Shows how much memory your project is consuming over time. The Overview also surfaces a Restart Count chart — a flat line at zero indicates no unexpected restarts. Rising memory that doesn't level off may indicate a memory leak or a need to increase your resource allocation.
Storage
Tracks disk space usage over time. Particularly useful for database projects where storage is expected to grow steadily. Monitor this to avoid running out of disk space unexpectedly.
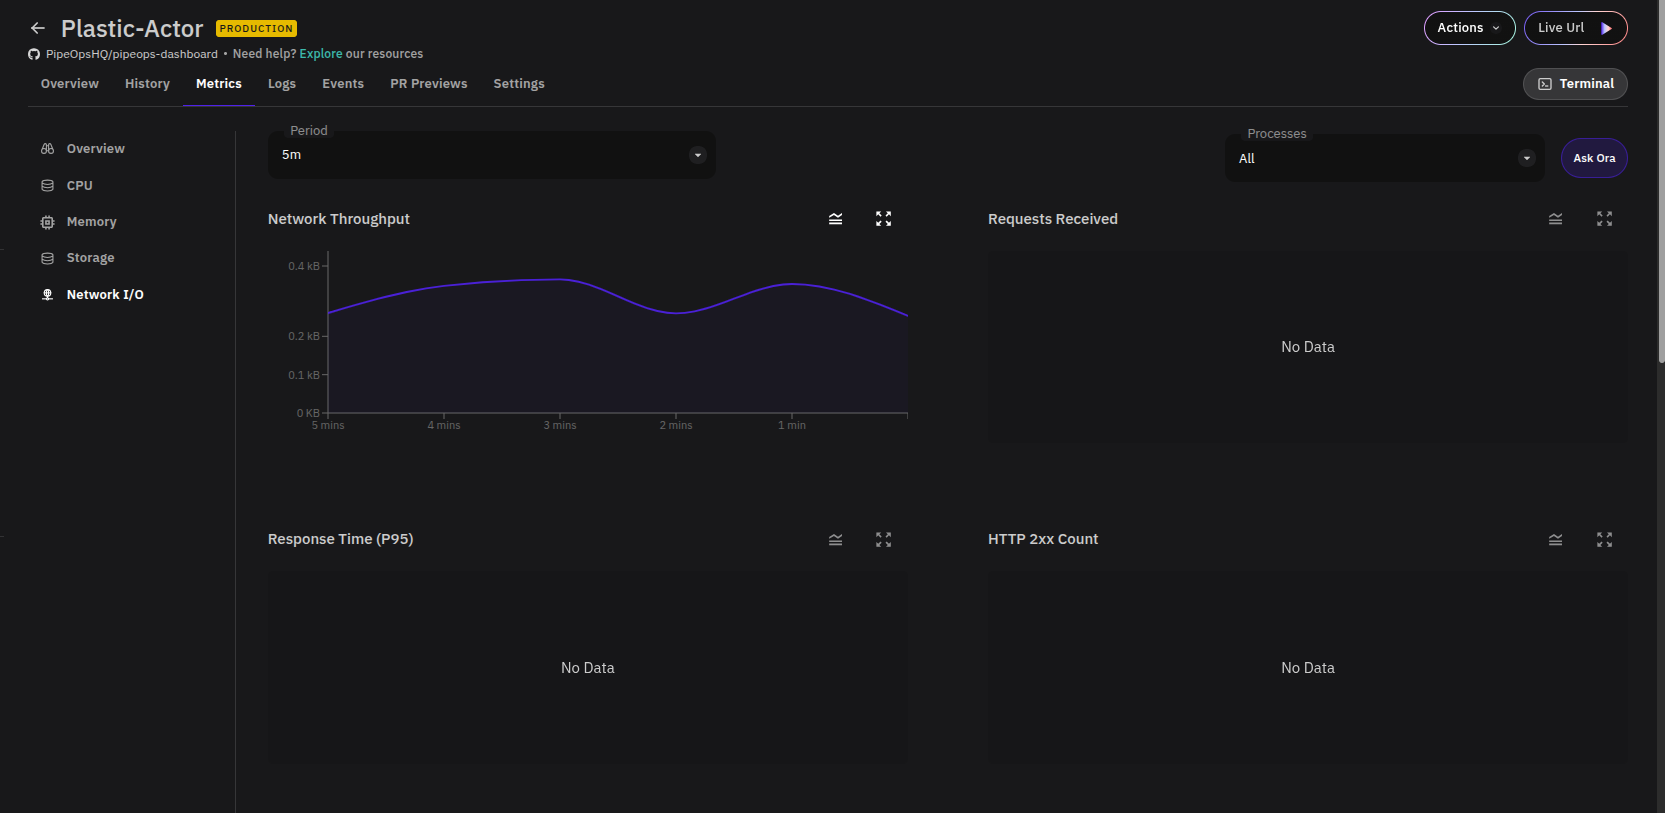
Network I/O
Shows inbound (Data Received) and outbound (Data Sent) transfer activity over time. Use this to understand traffic patterns and detect unusual spikes in data transfer.